How the forest products industry used Paycheck Protection Program loans (2022 update)
February 12, 2022
analytics forest products PPP loans logging
Summary
The Paycheck Protection Program (PPP) offered loans to businesses to provide a direct incentive for them to keep their workers on payroll. Forest products companies across the US received $4.7 billion in PPP loans offered through the Small Business Administration. Over 35,000 loans were offered to forest products companies in the US from April 2020 through May 2021, affecting 487,000 workers in the forest industry.
The Paycheck Protection Program
The US Small Business Administration (SBA) managed the Paycheck Protection Program (PPP) between April 2020 and May 2021. This loan program was created in response to business challenges presented by the COVID-19 pandemic.
The program provided loans to businesses to keep their workers on payroll, with many borrowers eligible for loan forgiveness. As of January 23, 2022, 87% of the total value in PPP loans distributed in 2020 and 2021 have been forgiven ($689 out of $790 billion).
In total, nearly 800 billion dollars were allocated to US companies as a part of the PPP. Funds for the loan program ran out in May 2021.
Approximately four percent of PPP loans were delivered to companies in the forestry and agricultural sector. This article summarizes information on PPP loans provided to businesses in the forest products industry.
PPP data
Data were acquired from the US SBA website (last updated 2 Jan 2022). To identify forest products companies, the North American Industry Classification System (NAICS) codes were obtained as a subset of the Agriculture, Forestry, Fishing and Hunting and Manufacturing industry titles. These represented 28 different industries including:
- Forest nurseries and gathering of forest products,
- Logging,
- Converted paper product manufacturing,
- Pulp, paper, and paperboard mills,
- Veneer, plywood, and engineered wood product manufacturing,
- Other wood product manufacturing, and
- Support activities for forestry
PPP loans to the forest products industry
Forest products companies received 35,474 loans for a total of $4.7 billion through the PPP program from April 2020 to May 2021. The SBA provided PPP loans through three rounds between April 3, 2020 and April 16, 2020 (Round One), April 27 and August 8, 2020 (Round 2), and December 27, 2020 and May 5, 2021 (Round 3).
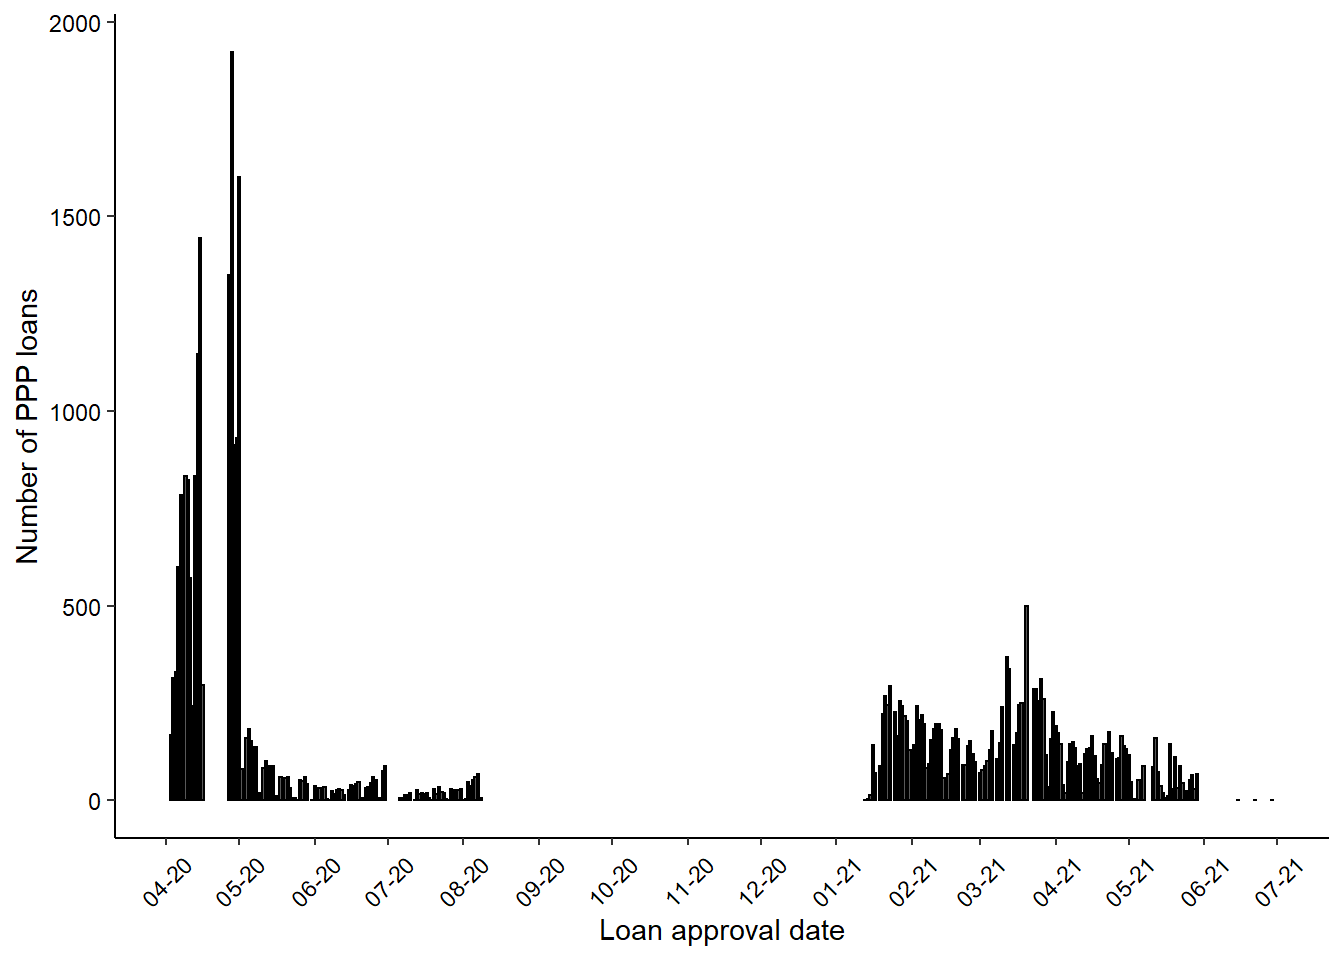
Fig. 1. Daily distribution of PPP loans to forest products companies in three rounds of funding."
The majority of PPP loans (46%) were provided in the third round of funding. Elsewhere, 26% and 29% of loans were provided in the first and second rounds of funding, respectively. There were 8,245 second draw loans from forest products companies that received a previous loan, or 30% of all loans.
Logging and other wood product manufacturing companies received 68% of all PPP loans (n = 24,235) provided to forest products companies:
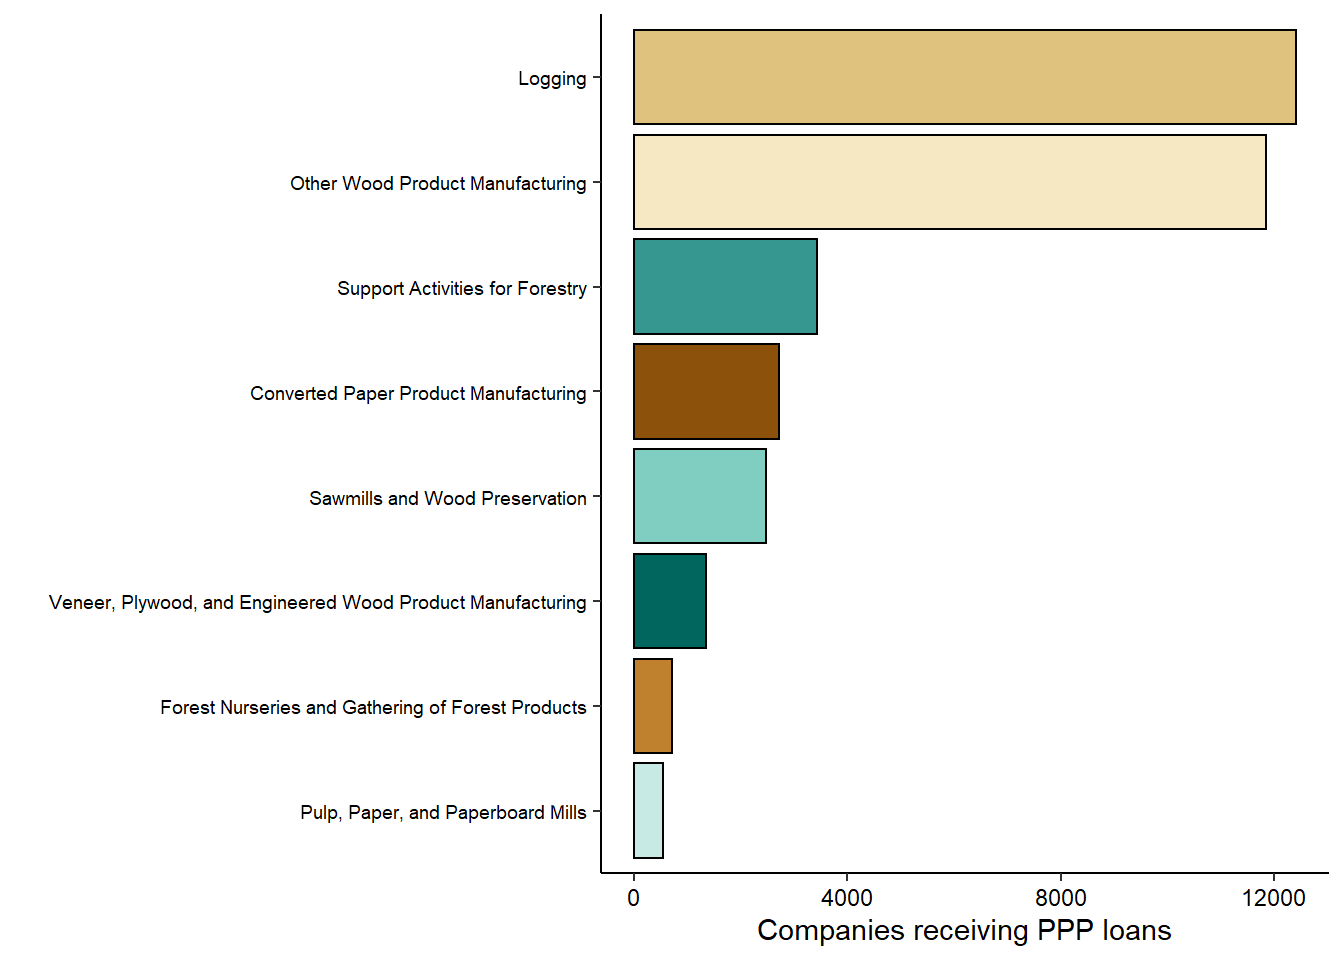
Fig. 2. Number of forest products companies that received PPP loans by NAICS industry classification.
Converted paper product manufacturers and pulp, paper, and paperboard mills received the largest loan amounts, exceeding $300,000 on average. These industries, along with veneer, plywood, and engineered wood product manufacturers, reported the greatest number of jobs supported through the PPP loan program.
| Industry | Num loans | Avg num jobs | Avg loan amount (USD) |
|---|---|---|---|
| Converted Paper Product Manufacturing | 2,715 | 34.8 | $383,919 |
| Pulp, Paper, and Paperboard Mills | 545 | 26.3 | $316,931 |
| Veneer, Plywood, and Engineered Wood Product Manufacturing | 1,347 | 28.4 | $265,448 |
| Sawmills and Wood Preservation | 2,477 | 19.1 | $177,070 |
| Other Wood Product Manufacturing | 11,834 | 16.2 | $148,092 |
| Support Activities for Forestry | 3,428 | 8.8 | $73,507 |
| Forest Nurseries and Gathering of Forest Products | 727 | 8.5 | $68,349 |
| Logging | 12,401 | 5.3 | $50,793 |
The number of forest industry jobs reported in PPP loan applications was positively related to PPP loan amounts (p < 0.001, \(R^2\) = 0.800). Most applications reported that the PPP loan would support fewer than 20 jobs with loans amounts lower than $200,000.
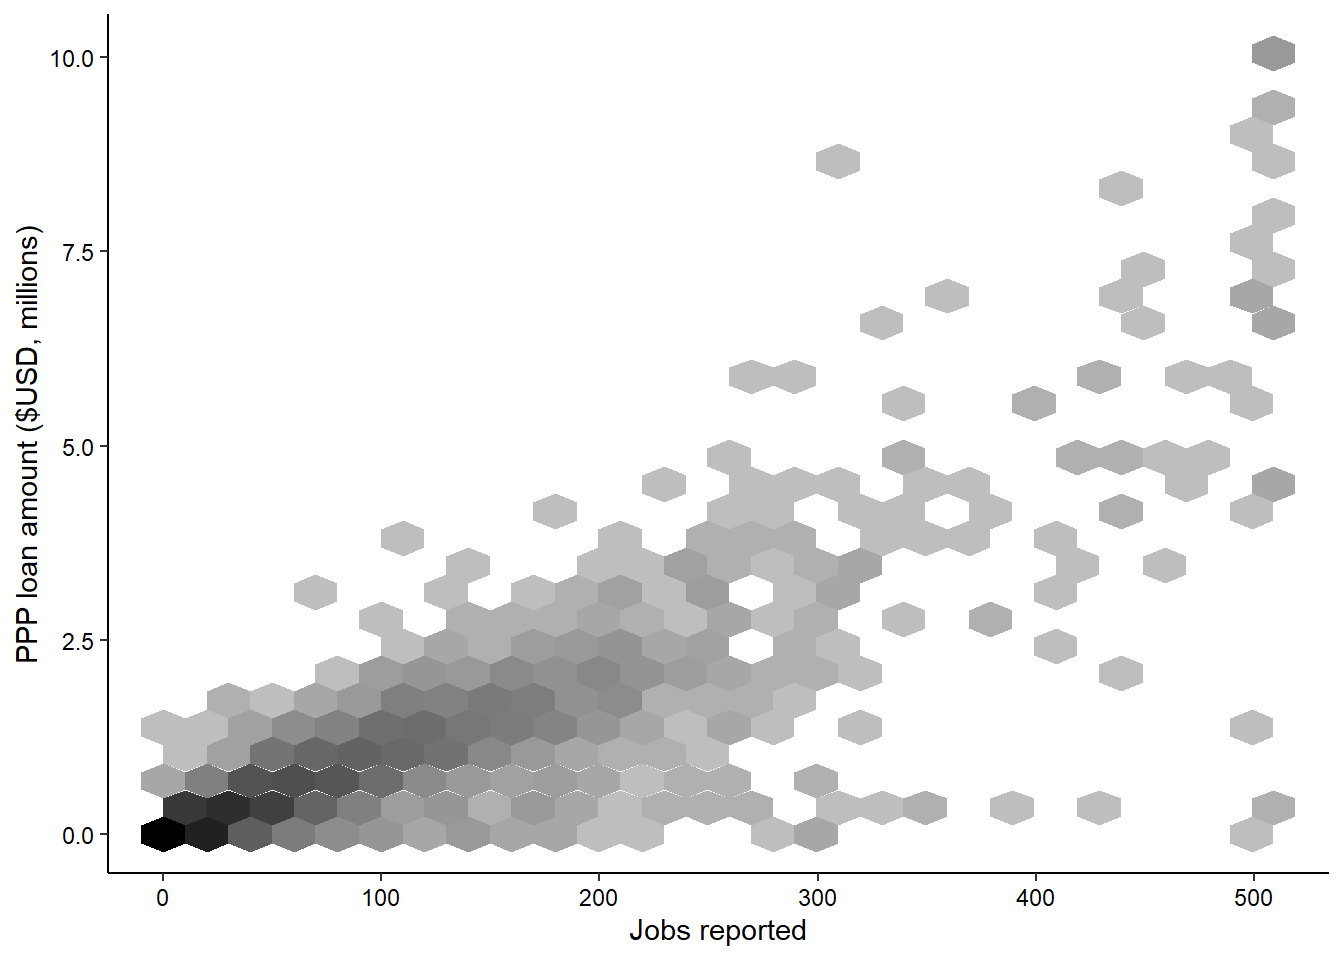
Fig. 3. Number of forest industry jobs reported in PPP loans, with darker areas indicating greater number of loans.
The majority of PPP loans (61%) were provided to forest product companies at an amount less than $50,000. Loans greater than $350,000 represented 61% of the total approved value of loans to all forest products companies.
| Loan size (USD) | Num loans | Total approved value (USD, millions) | Percent of approved loans | Percent of approved value |
|---|---|---|---|---|
| < 50K | 21,622 | 386.3 | 61.0 | 8.2 |
| 50K - 100K | 4,879 | 351.1 | 13.8 | 7.5 |
| 100K - 150K | 2,332 | 288.4 | 6.6 | 6.1 |
| 150K - 350K | 3,598 | 822.7 | 10.1 | 17.5 |
| 350K - 1M | 2,139 | 1,212.6 | 6.0 | 25.8 |
| 1M - 2M | 587 | 815.9 | 1.7 | 17.4 |
| 2M - 5M | 156 | 481.1 | 0.4 | 10.2 |
| > 5M | 161 | 337.2 | 0.5 | 7.2 |
PPP loans provided to logging companies supported the greatest number of jobs (65,438) across all forest industries. Loan amounts to specific logging companies supported the smallest number of jobs on average, however, over 12,000 loans were provided to this industry.
PPP loans provided to companies in the softwood veneer and plywood manufacturing and folding paperboard box manufacturing industries each saw the greatest loan amounts on average, in excess of $600,000. Companies in these industries supported fewer total numbers of jobs across the industry, but a greater number of jobs supported within each company.
| Industry | Num loans | Avg loan value (USD) | Total loan value (USD, millions) | Avg num jobs | Total num jobs |
|---|---|---|---|---|---|
| Logging | 12,401 | 50,793 | 629.9 | 5.3 | 65,438 |
| All Other Miscellaneous Wood Product Manufacturing | 4,496 | 113,353 | 509.6 | 12.2 | 54,918 |
| Wood Container and Pallet Manufacturing | 2,276 | 167,078 | 380.3 | 21.7 | 49,436 |
| Sawmills | 2,106 | 187,306 | 394.5 | 20.2 | 42,643 |
| Support Activities for Forestry | 3,428 | 73,507 | 252.0 | 8.8 | 30,035 |
| Other Millwork (including Flooring) | 2,015 | 144,846 | 291.9 | 14.6 | 29,458 |
| Corrugated and Solid Fiber Box Manufacturing | 713 | 456,261 | 325.3 | 39.9 | 28,446 |
| Wood Window and Door Manufacturing | 1,313 | 206,045 | 270.5 | 19.4 | 25,520 |
| All Other Converted Paper Product Manufacturing | 589 | 310,425 | 182.8 | 28.7 | 16,892 |
| Paper Bag and Coated and Treated Paper Manufacturing | 448 | 408,196 | 182.9 | 37.1 | 16,605 |
| Hardwood Veneer and Plywood Manufacturing | 493 | 285,075 | 140.5 | 31.4 | 15,479 |
| Truss Manufacturing | 429 | 305,422 | 131.0 | 34.8 | 14,924 |
| Folding Paperboard Box Manufacturing | 241 | 603,910 | 145.5 | 51.6 | 12,427 |
| Prefabricated Wood Building Manufacturing | 567 | 192,605 | 109.2 | 19.6 | 11,127 |
| Manufactured Home (Mobile Home) Manufacturing | 560 | 175,457 | 98.3 | 19.0 | 10,625 |
| Cut Stock, Resawing Lumber, and Planing | 607 | 152,798 | 92.7 | 17.0 | 10,319 |
| Stationery Product Manufacturing | 388 | 265,244 | 102.9 | 24.6 | 9,543 |
| Paper (except Newsprint) Mills | 315 | 324,282 | 102.1 | 26.7 | 8,426 |
| Forest Nurseries and Gathering of Forest Products | 727 | 68,349 | 49.7 | 8.5 | 6,161 |
| Other Paperboard Container Manufacturing | 201 | 254,743 | 51.2 | 27.9 | 5,600 |
| Sanitary Paper Product Manufacturing | 135 | 382,620 | 51.7 | 37.2 | 5,019 |
| Wood Preservation | 371 | 118,963 | 44.1 | 12.5 | 4,638 |
| Softwood Veneer and Plywood Manufacturing | 62 | 687,273 | 42.6 | 51.6 | 3,197 |
| Paperboard Mills | 98 | 333,931 | 32.7 | 32.0 | 3,137 |
| Engineered Wood Member (except Truss) Manufacturing | 122 | 230,229 | 28.1 | 24.3 | 2,962 |
| Pulp Mills | 84 | 347,066 | 29.2 | 25.5 | 2,146 |
| Reconstituted Wood Product Manufacturing | 241 | 63,453 | 15.3 | 6.9 | 1,658 |
| Newsprint Mills | 48 | 181,241 | 8.7 | 13.3 | 640 |
California forest products companies received the greatest number of loans (2,019) and the largest amount ($358 million) across all US states. Seven other states received in excess of $200 million each in PPP loans to forest products companies: Oregon, Pennsylvania, Ohio, Texas, New York, Wisconsin, and Michigan.
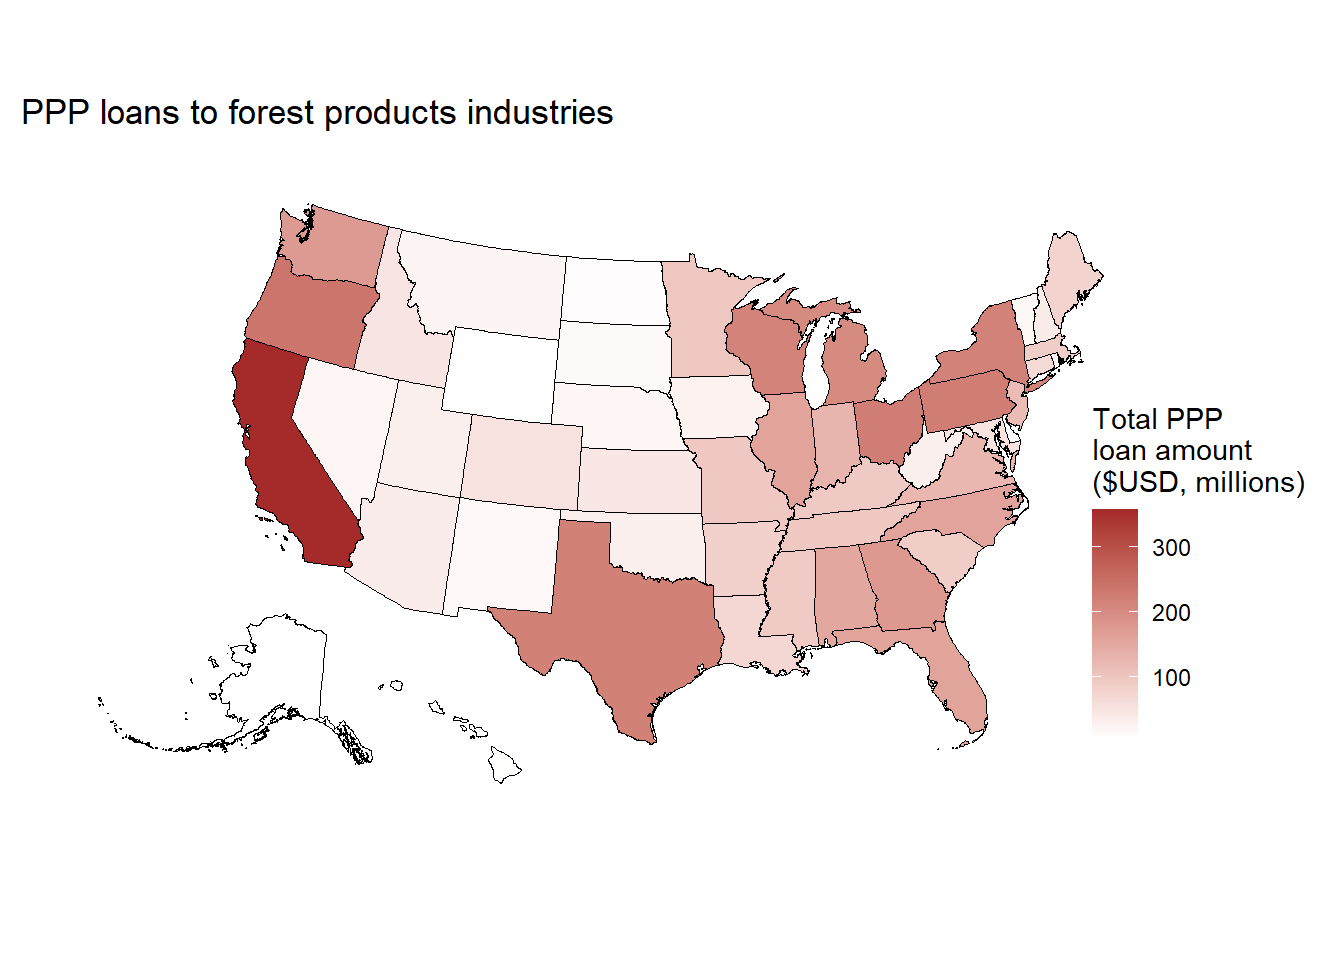
Fig. 4. Total value of PPP loans provided to forest products companies
New Jersey saw the greatest average loan value at $249,013. The US Virgin Islands, Hawaii, Vermont, Puerto Rico, and Wyoming saw the smallest average loan value, each less than $60,000.
| State name | Num loans | Avg loan value (USD) | Total loan value (USD, millions) | Avg num jobs | Total num jobs |
|---|---|---|---|---|---|
| Alaska | 73 | 66,156 | 4.8 | 6.9 | 506 |
| Alabama | 1,373 | 110,909 | 152.3 | 11.8 | 16,262 |
| Arkansas | 1,119 | 73,445 | 82.2 | 8.5 | 9,537 |
| Arizona | 241 | 142,234 | 34.3 | 19.6 | 4,731 |
| California | 2,019 | 177,243 | 357.9 | 17.7 | 35,775 |
| Colorado | 401 | 127,407 | 51.1 | 12.6 | 5,059 |
| Connecticut | 326 | 192,942 | 62.9 | 14.4 | 4,681 |
| District of Columbia | 12 | 240,649 | 2.9 | 18.8 | 226 |
| Delaware | 40 | 163,570 | 6.5 | 16.6 | 662 |
| Florida | 1,422 | 110,818 | 157.6 | 12.5 | 17,771 |
| Georgia | 1,512 | 116,427 | 176.0 | 13.3 | 20,155 |
| Hawaii | 79 | 46,723 | 3.7 | 4.9 | 386 |
| Iowa | 338 | 73,246 | 24.8 | 8.3 | 2,814 |
| Idaho | 420 | 108,448 | 45.5 | 12.4 | 5,210 |
| Illinois | 980 | 162,347 | 159.1 | 15.5 | 15,184 |
| Indiana | 730 | 175,005 | 127.8 | 18.0 | 13,138 |
| Kansas | 191 | 222,585 | 42.5 | 20.1 | 3,843 |
| Kentucky | 1,032 | 91,299 | 94.2 | 10.6 | 10,945 |
| Louisiana | 784 | 89,546 | 70.2 | 9.8 | 7,661 |
| Massachusetts | 412 | 208,877 | 86.1 | 16.9 | 6,964 |
| Maryland | 269 | 183,729 | 49.4 | 17.5 | 4,715 |
| Maine | 838 | 92,246 | 77.3 | 10.4 | 8,720 |
| Michigan | 1,251 | 160,415 | 200.7 | 16.8 | 20,959 |
| Minnesota | 835 | 117,048 | 97.7 | 11.7 | 9,804 |
| Missouri | 1,409 | 67,140 | 94.6 | 7.4 | 10,468 |
| Northern Mariana Islands | 1 | 145,000 | 0.1 | 38.0 | 38 |
| Mississippi | 1,348 | 66,675 | 89.9 | 8.3 | 11,239 |
| Montana | 305 | 64,454 | 19.7 | 7.4 | 2,266 |
| North Carolina | 1,232 | 128,518 | 158.3 | 14.3 | 17,565 |
| North Dakota | 60 | 131,245 | 7.9 | 13.4 | 806 |
| Nebraska | 141 | 127,184 | 17.9 | 14.2 | 1,999 |
| New Hampshire | 291 | 120,995 | 35.2 | 10.4 | 3,034 |
| New Jersey | 468 | 249,013 | 116.5 | 21.7 | 10,174 |
| New Mexico | 105 | 122,608 | 12.9 | 15.8 | 1,655 |
| Nevada | 122 | 141,099 | 17.2 | 15.0 | 1,824 |
| New York | 1,290 | 167,045 | 215.5 | 16.6 | 21,392 |
| Ohio | 1,075 | 206,680 | 222.2 | 21.6 | 23,257 |
| Oklahoma | 387 | 76,107 | 29.5 | 9.4 | 3,651 |
| Oregon | 1,007 | 235,947 | 237.6 | 22.7 | 22,909 |
| Pennsylvania | 1,377 | 162,519 | 223.8 | 15.9 | 21,877 |
| Puerto Rico | 102 | 57,670 | 5.9 | 12.6 | 1,287 |
| Rhode Island | 100 | 194,368 | 19.4 | 20.3 | 2,033 |
| South Carolina | 634 | 137,419 | 87.1 | 14.8 | 9,400 |
| South Dakota | 151 | 81,426 | 12.3 | 8.4 | 1,263 |
| Tennessee | 1,278 | 74,934 | 95.8 | 8.7 | 11,059 |
| Texas | 1,601 | 136,047 | 217.8 | 14.5 | 23,274 |
| Utah | 214 | 135,605 | 29.0 | 16.7 | 3,570 |
| Virginia | 894 | 138,258 | 123.6 | 15.4 | 13,755 |
| U.S. Virgin Islands | 3 | 34,812 | 0.1 | 7.7 | 23 |
| Vermont | 302 | 53,697 | 16.2 | 5.3 | 1,604 |
| Washington | 878 | 197,541 | 173.4 | 16.8 | 14,721 |
| Wisconsin | 1,534 | 139,432 | 213.9 | 13.9 | 21,320 |
| West Virginia | 388 | 76,920 | 29.8 | 9.6 | 3,720 |
| Wyoming | 79 | 58,585 | 4.6 | 6.7 | 526 |
In 2020, Pelkki and Sherman reported on each state’s economic contribution from the forest industry. It seems useful to compare a state’s use of PPP loans to the contribution of forestry to GDP in that state. The table below shows the rankings of total contribution of forestry a state’s GDP (compiled from Pelkki and Sherman 2020; their Figure 2) alongside the ranking of total PPP loan amounts provided to states.
| State | Total contribution to GDP rank | Total PPP loan value rank |
|---|---|---|
| California | 1 | 1 |
| Pennsylvania | 2 | 3 |
| Wisconsin | 3 | 7 |
| Georgia | 4 | 9 |
| North Carolina | 5 | 12 |
| Texas | 6 | 5 |
| Ohio | 7 | 4 |
| New York | 8 | 6 |
| Tennessee | 9 | 19 |
| Alabama | 10 | 14 |
Rankings for each state are generally consistent with a few notable exceptions. States in the Pacific Northwest (Oregon and Washington) along with Michigan were “PPP winners”, obtaining a greater proportion of PPP loans relative to their state’s economic contribution to GDP. States in the southeastern US (Tennessee, Alabama, and North Carolina) ranked in the top ten for total contribution to GDP but outside of the top ten in their total value of PPP loans requested.
Conclusion
In total, PPP loans to the forest products industry helped to support 487,000 jobs with loan amounts totaling $4.7 billion. Over 35,000 loans were offered to forest products companies in the US from April 2020 through May 2021 through the PPP program. Funds for the PPP program ran out three weeks earlier than expected in early May 2021, pointing to a slow economic recovery across US businesses. In the forest products industry, PPP loans have no doubt helped companies to keep workers employed in this essential industry.
–
By Matt Russell
Email Matt with any questions or comments. Sign up for The Landing for monthly in-depth analysis on data and analytics in the forest products industry.