Quickly explore your timber cruise data with six lines of code
The inspectdf package in R allows you to quickly summarize timber cruise data by species, tree status, and other variables.
Data viz timber cruise forest inventory inspectdf Communicating dataData from timber cruises and other forest inventories need to be clean and easy to interpret. Time can be lost in the field and office if data were collected sloppily, were measured in the field without a protocol, or are otherwise “messy” with lots of errors.
A data-checking routine can save time, money, and resources. Identifying potential data inaccuracies or inconsistencies soon after they’re collected can help eliminate any inappropriate decisions that are made from those data further down the line.
Don’t have a data-checking routine in place? Data-checking routines can ensure quality and reliability in forest inventories and contribute to quality assurance and quality control.
Data-checking routines can also instill confidence in field crew members that are cruising timber. The job performance of forest analysts is due in part to the quality of data they’re working with. Having forest inventory data that everyone in a company can trust is essential for basing multi-million dollar decisions.
An R package for quickly exploring data sets
Any good data checking routine would have a number of attributes:
- it loads data quickly and efficiently,
- it provides a useful numerical summary of important tree and stand attributes, and
- it provides useful visualizations for exploring timber cruise data.
Fortunately the inspectdf package developed by Alastair Rushworth provides an easy-to-use tool that allows an analyst to inspect, compare, and visualize data frames in R.
The inspectdf package can be loaded either from CRAN or from Github through the install_github() function in the devtools package. It is also useful to load the tidyverse package to accompany the series of graphs that the inspectdf package relies on:
# devtools::install_github("alastairrushworth/inspectdf")
library(inspectdf)
library(tidyverse)
The Cloquet timber cruise data
In 2014 a field crew remeasured 389 fixed-radius permanent sample plots at the Cloquet Forestry Center in Cloquet, Minnesota. Trees greater than 5.0 inches diameter at breast height (DBH) were measured on a 1/7th acre fixed-radius plot and and trees smaller than 5.0 inches DBH were measured on a 1/100th acre plot. The data were comprised of 14,947 individual tree observations.
The Cloquet data set (tree) includes two numerical variables:
- tree diameter at breast height (DBH), and
- total tree height in feet (HT)
Also included are five categorical variables:
- the primary cover species where the plot is located (CoverType),
- the status of the tree (e.g., growth tree/standing dead tree; TreeClass),
- the crown class of the tree (e.g., dominant/overtopped; CrownClass),
- the crown ratio of the tree, categorized in ten percent increments (CrownRatio), and
- a two-letter code indicating tree species (SPP)
The data include a variety of species in various in a variety of conditions:
| CoverType | DBH | TreeClass | CrownClass | CrownRatio | HT | SPP |
|---|---|---|---|---|---|---|
| Red pine | 19.8 | Standing dead | Dominant | 21-30% | 80 | WP |
| White pine | 12.9 | Growth tree | Dominant | 11-20% | NA | WP |
| Nonforest | 12.0 | Harvested | Codominant | 71-80% | NA | WP |
| Red pine | 11.6 | Growth tree | Codominant | 31-40% | 78 | WP |
| Upland mixed hardwoods | 5.3 | Ingrowth tree | Codominant | 51-60% | NA | WP |
| Red pine | 19.3 | Standing dead | Codominant | 31-40% | 95 | WP |
The inspectdf functions
The inspect_types() function allows you to inspect the column types for each variable in the data set. In the Cloquet data set it reads the two numeric variables and five categorical variables as factors:
inspect_types(tree) %>% show_plot()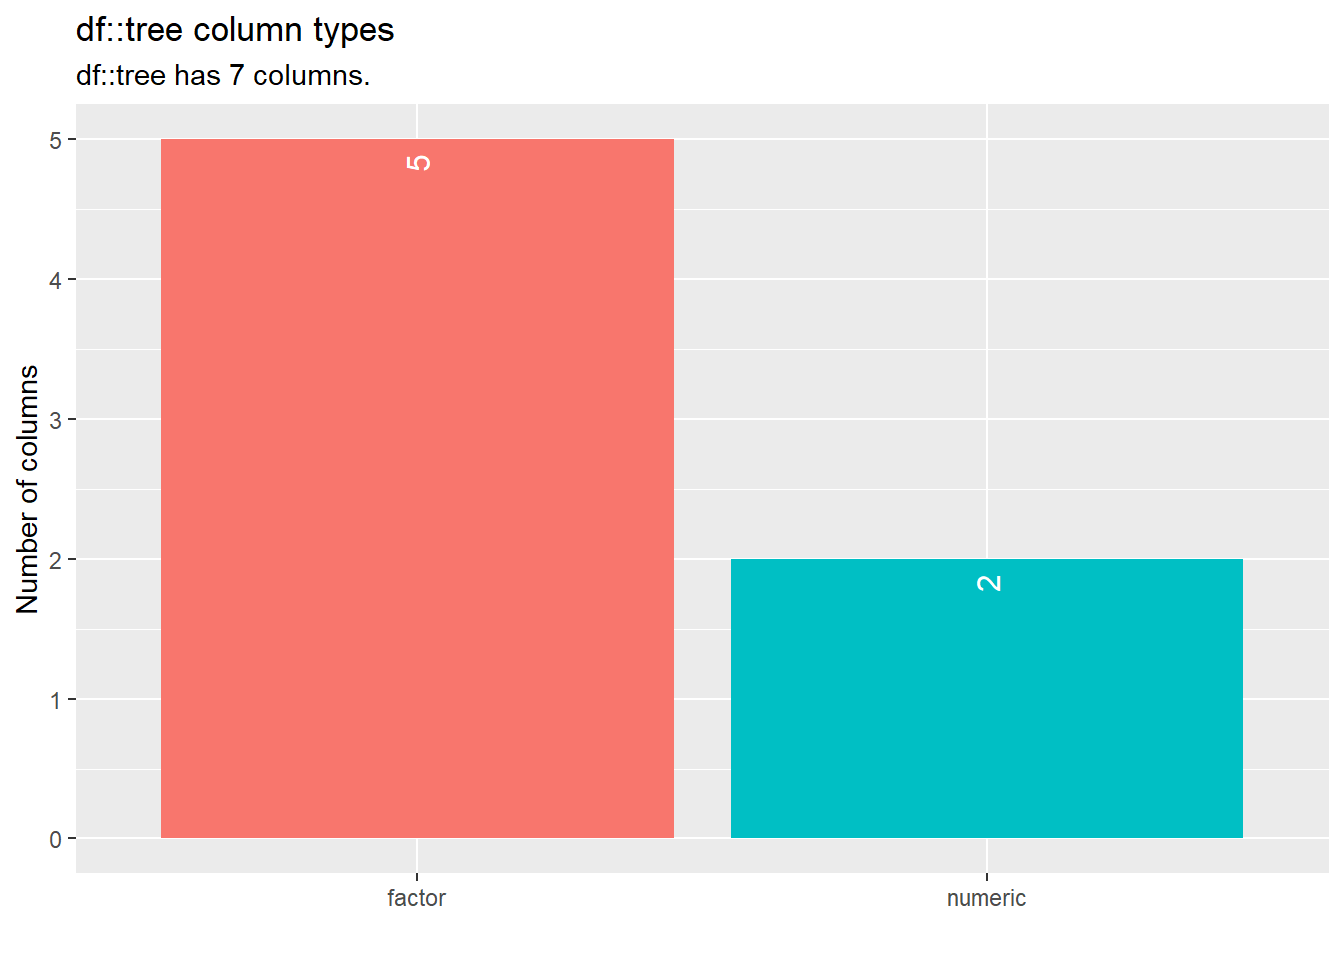
The inspect_na() function summarizes each column and presents the percentage of observations that are missing (i.e., ones that have NA values). In the Cloquet data set the only variable with missing data is HT.
In total, 80% of tree observations do not contain a HT measurement. This agrees with the plot measurement protocol of measuring every fifth tree for height as a part of a subsample:
inspect_na(tree) %>% show_plot()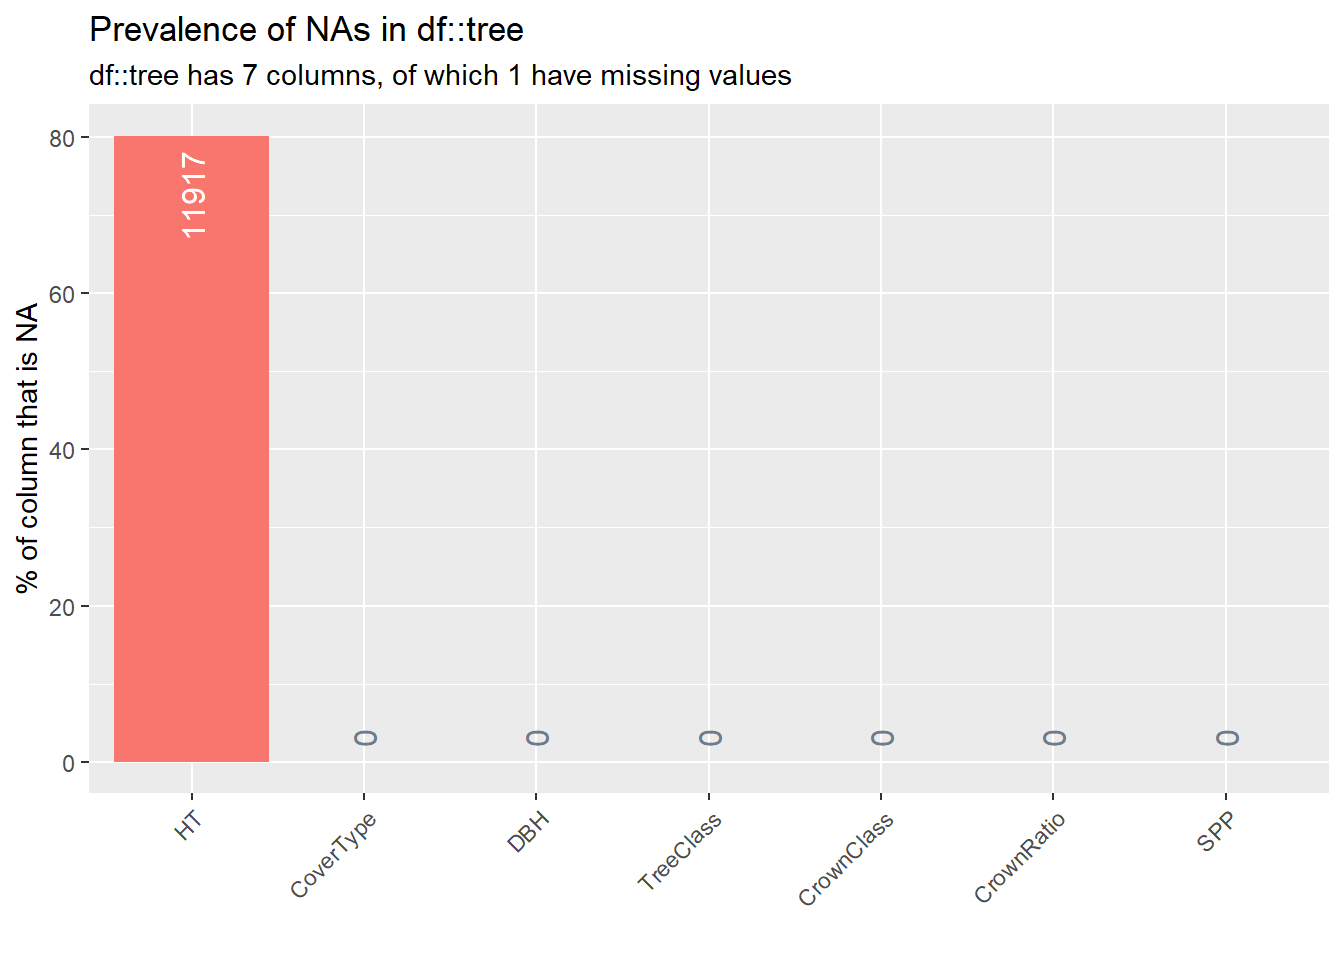
The inspect_num() function provides a histogram of the distribution of all numeric columns in the data. The function allows you to quickly spot outliers and data entry errors in the data. In the Cloquet data set, DBH peaks around eight inches and HT around 50 feet:
inspect_num(tree) %>% show_plot()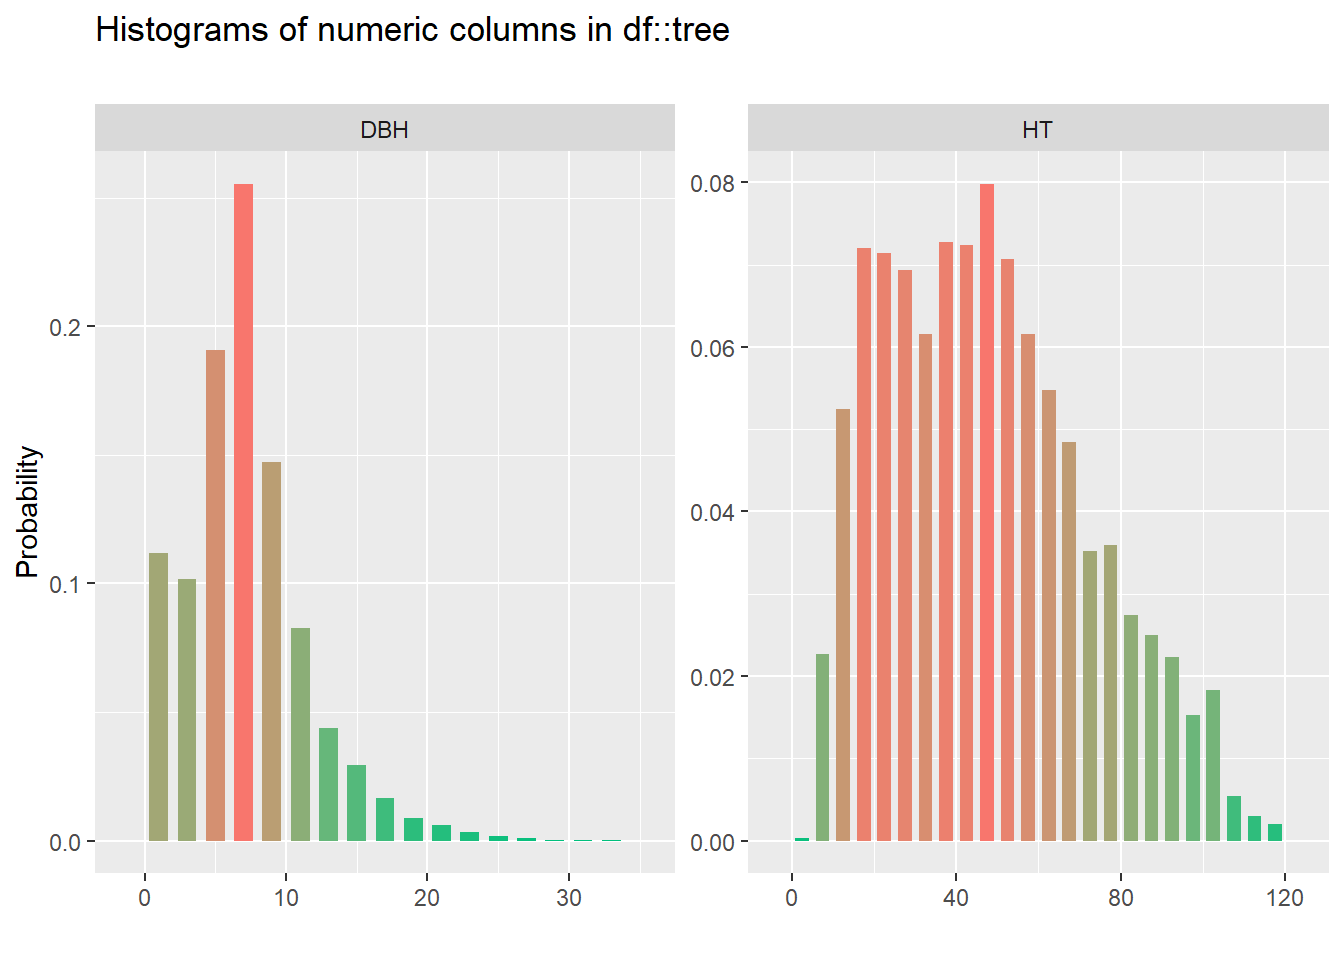
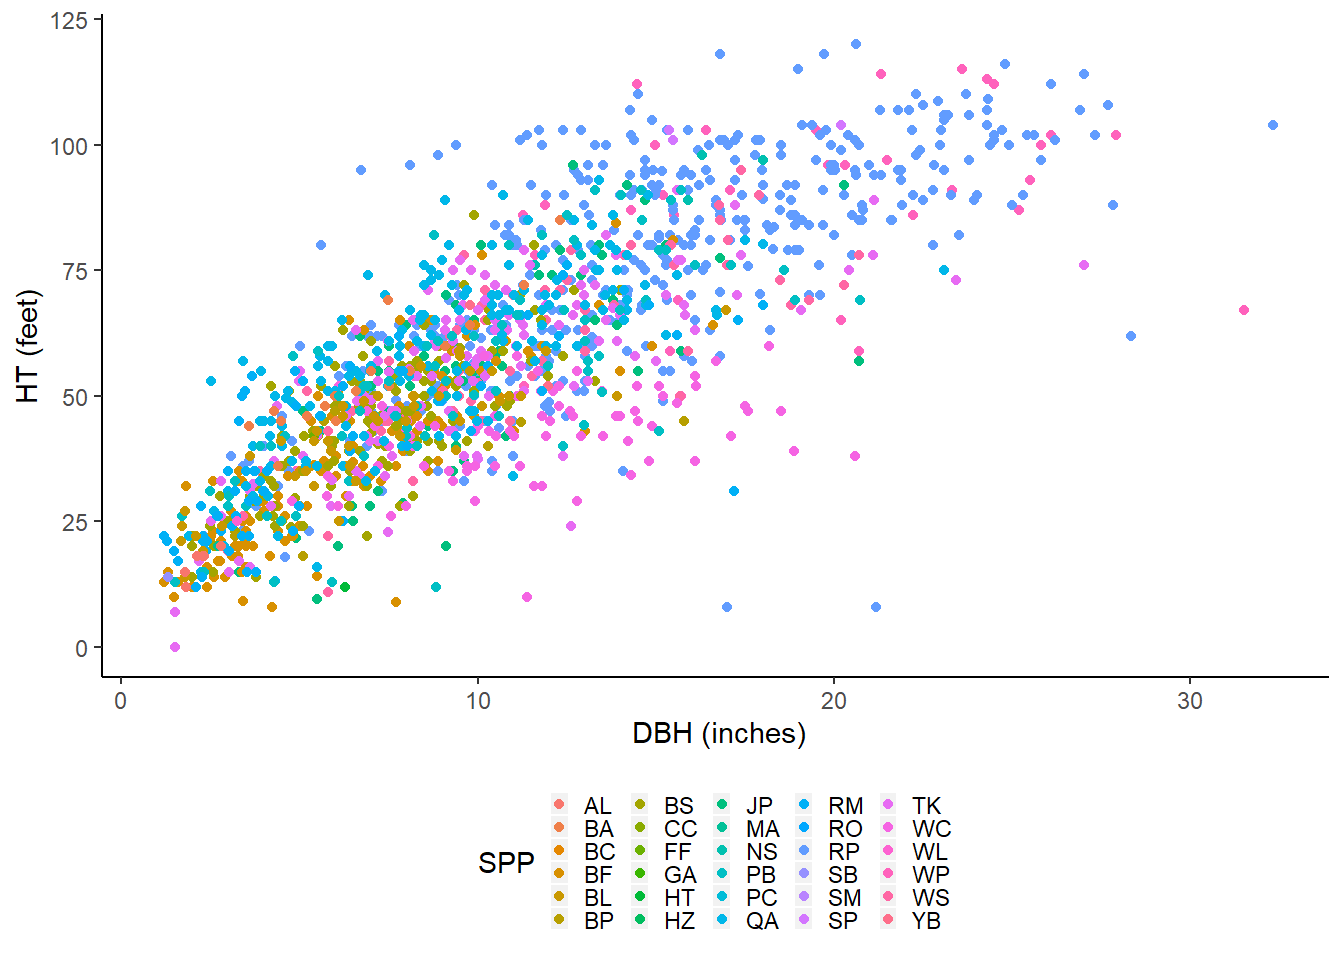
The inspect_cor() function provides the Pearson correlation coefficient for all numeric variables in the data set. In the Cloquet data set, we see that DBH and HT have a correlation coefficient of 0.772, which is what we would expect after inspecting the HT-DBH scatter plot shown previously:
inspect_cor(tree)## # A tibble: 1 x 7
## col_1 col_2 corr p_value lower upper pcnt_nna
## <chr> <chr> <dbl> <dbl> <dbl> <dbl> <dbl>
## 1 HT DBH 0.772 0 0.757 0.787 19.9The inspect_cat() function provides a graph showing the frequency of categorical levels in the data using a stacked bar chart. We can see that red pine (RP) and aspen (QA) are the most common cover types and species, most trees are in a codominant crown position, crown ratio is typically between 21 and 40%, and most observations are on growth trees (those that were measured in past inventories) or ingrowth trees:
inspect_cat(tree) %>% show_plot() 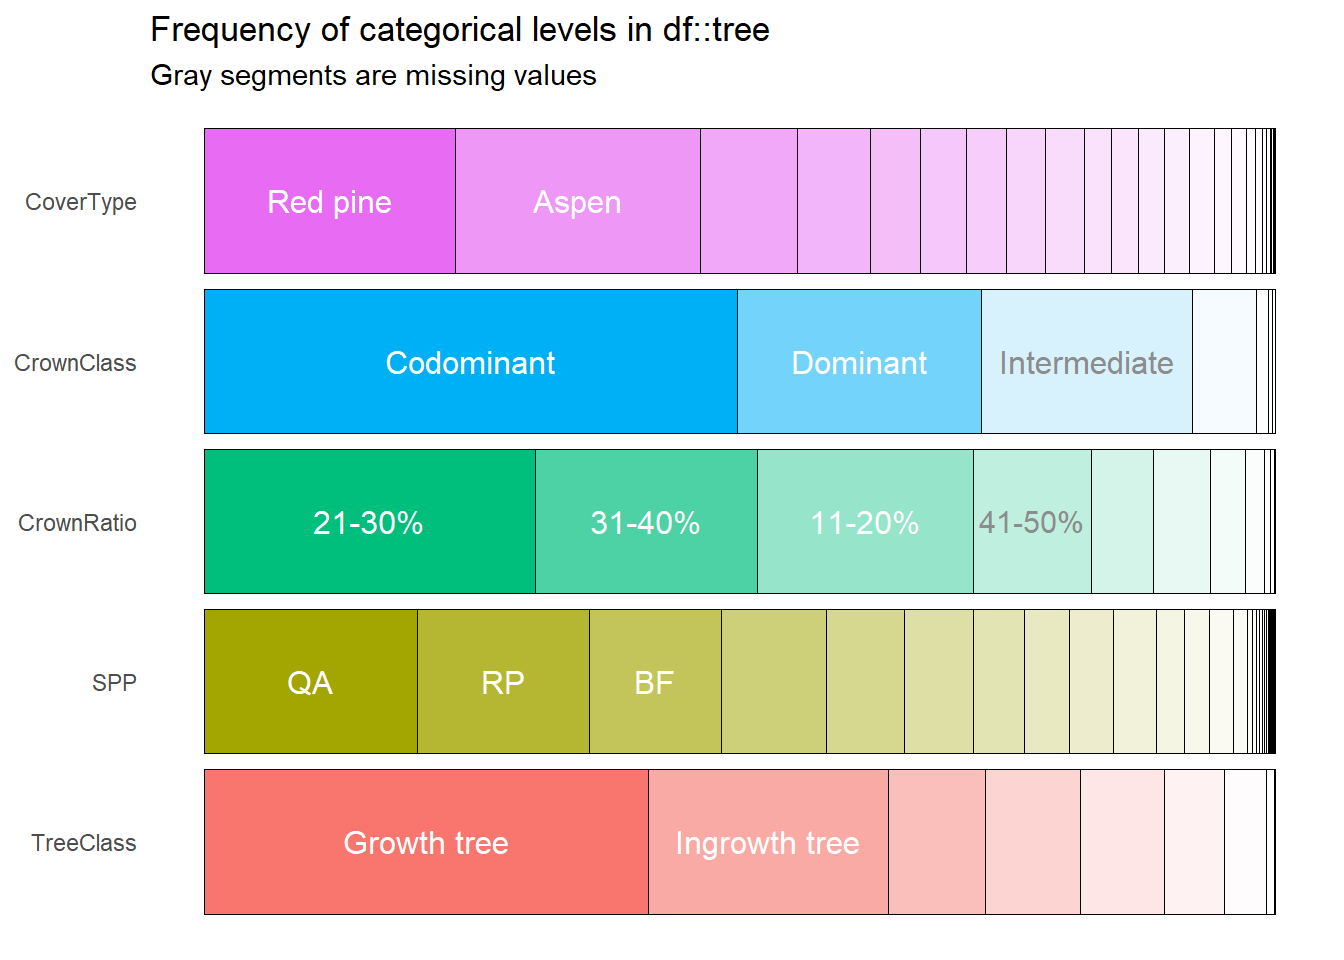
For large timber cruise data sets, or for data sets when memory limits pose a problem, the inspect_mem() function may be useful. The function provides a graph showing the total size of the data set and the contribution of each column to its total volume. The Cloquet data are 532.25 Kb, and the numeric variables DBH and HT occupy the most space in the data (116.24 Kb each):
inspect_mem(tree) %>% show_plot()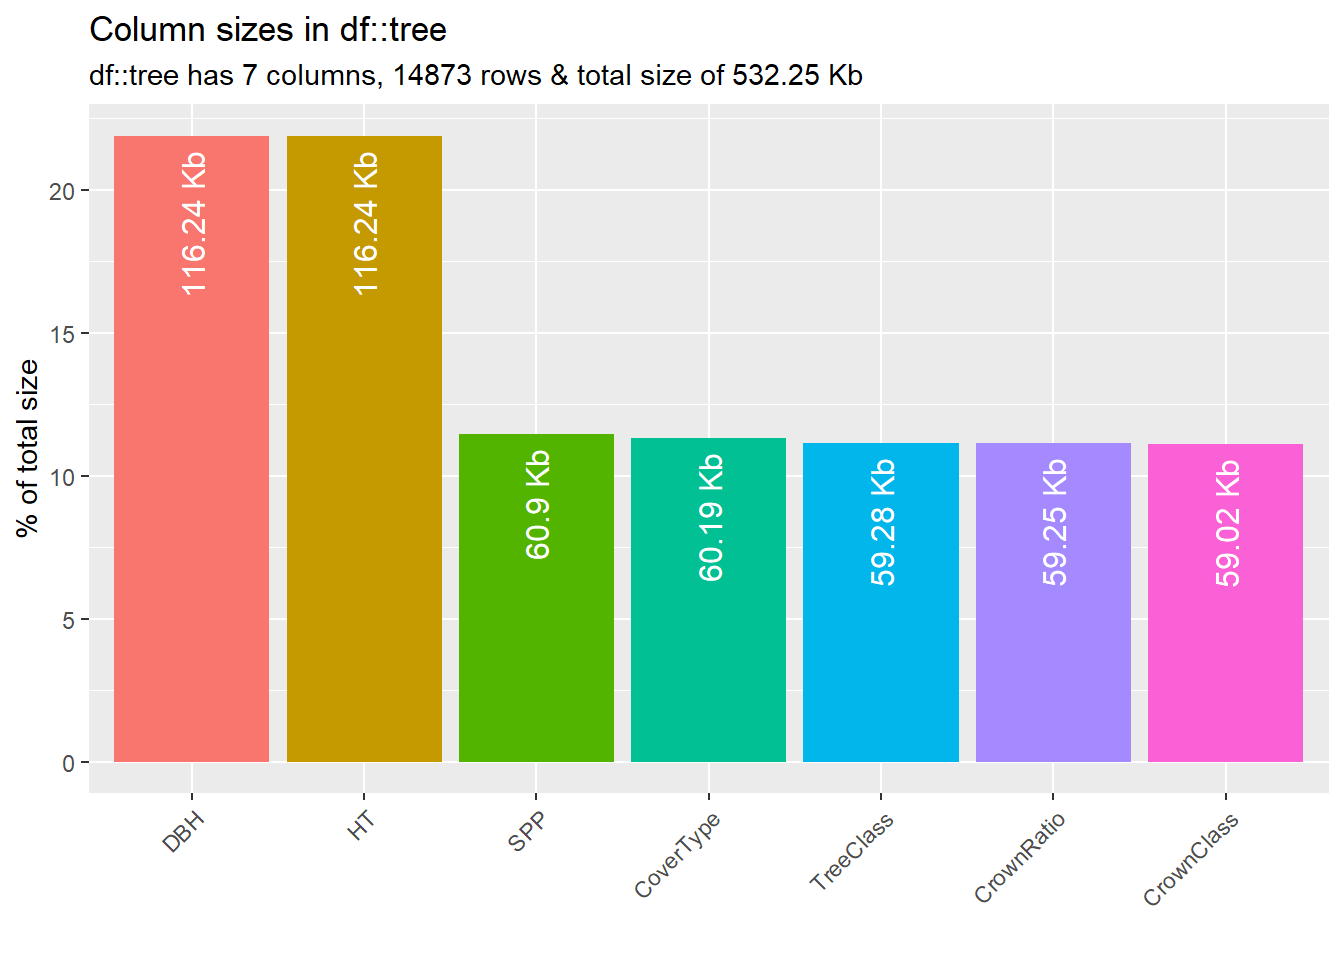
Summary
The inspectdf package is useful to quickly analyze any timber cruise data set. It provides simple numeric output, produces easy-to-interpret visualizations, and requires a minimal amount of code through its functions.
All of these reasons are advantages to rapidly assess timber cruise data quality. Incorporating data quality routines in your everyday work flow can provide confidence and increase the reliability in forest inventory data.
By Matt Russell. Leave a comment below or email Matt with any questions or comments.