How to determine accuracy of classification models (with forestry data)
January 13, 2020
classification statistics Machine learning regressionClassification is the process when you predict something, and that something is a class or label. It’s widely used when analyzing and modeling forestry data. Data scientists use if often as one of the many machine learning algorithms.
You might have learned about classification in the context of logistic regression. In logistic regression, your outcome is a binary class of data. For example, a tree can be alive or dead. Or a team could win or lose a game. In addition, logistic regression could allow an outcome for multiple classes of data. For example, a team could win lose, tie, or forfeit a game.
Classification is an an example of supervised learning. That is, we have an x-y pair and are interested in finding a relationship between two variables. Linear regression is another common type of supervised learning.
So, how do you know if a classification model is an accurate one?
Classification: an example with tree species
Say you have a sample of five trees. You want to predict their species based on an image of its leaves. You know the five species are an oak, elm, buckeye, oak, and ash:
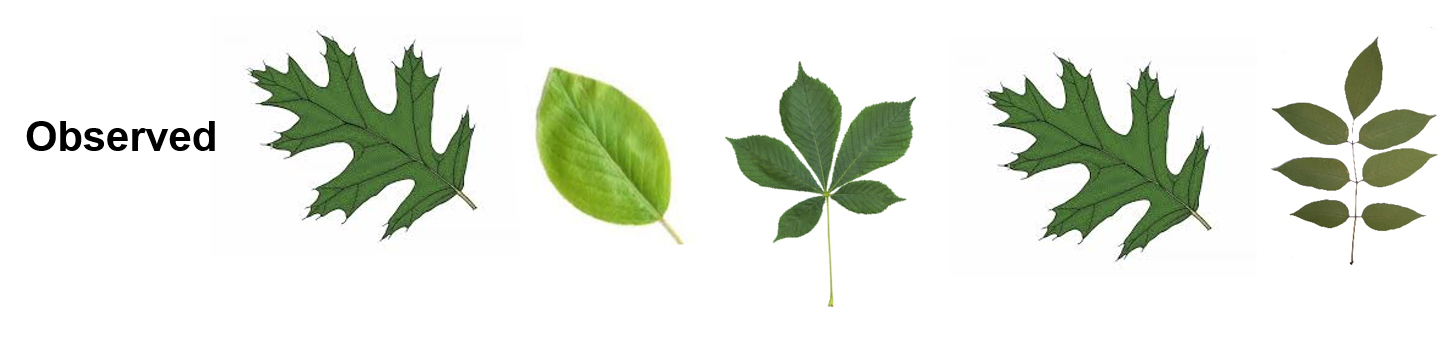
Five example trees.
Next, you create a model based on the images of the leaves. Then, you use that model to predict the species.
The model runs on a lot of data to train it to identify its species. In the model, there may be dozens of trees that are possible to predict.
After you make the predictions, you find the model to correctly predict three out of the five species correctly. It incorrectly predicted the elm to be a different species with a compound leaf arrangement. And, it predicted the buckeye to be a different species of oak:
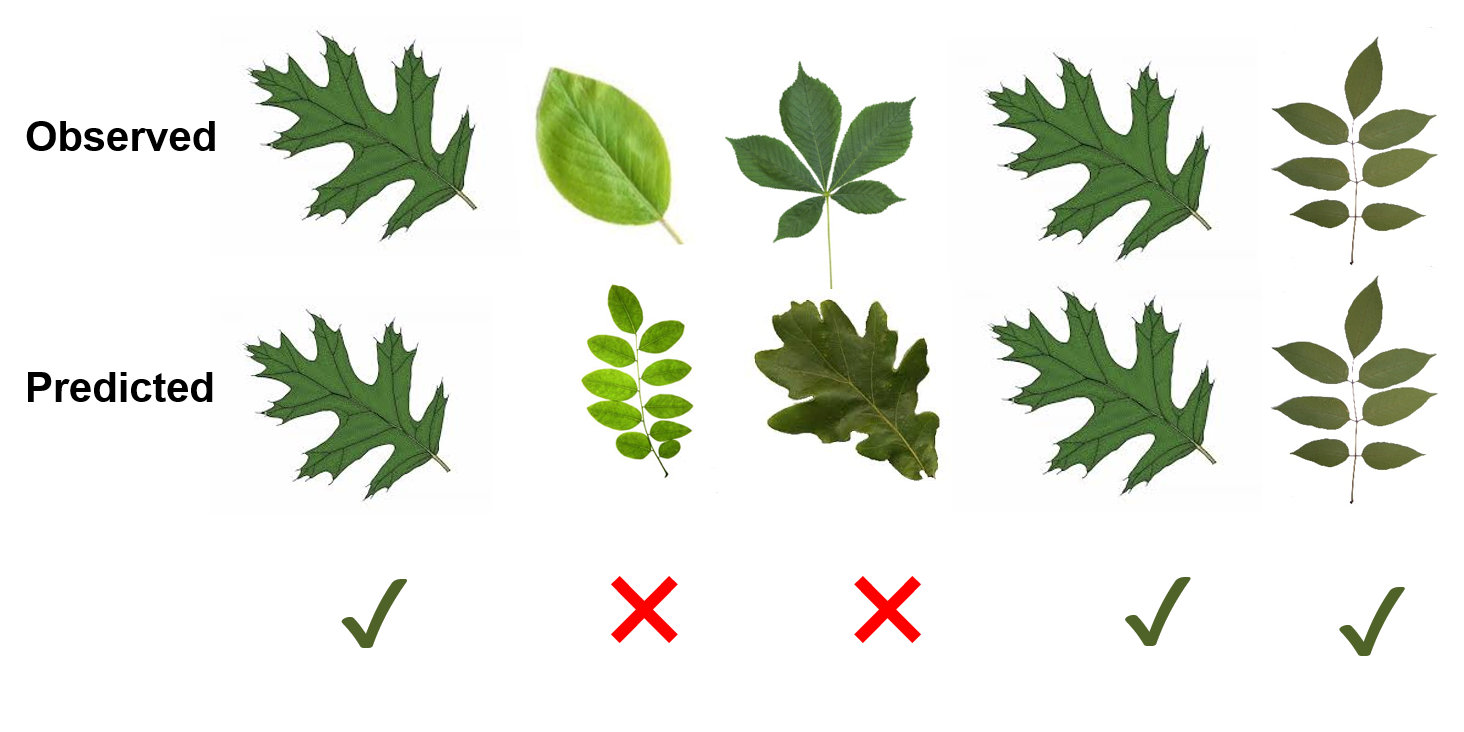
Five example trees, with predictions.
In this example, the accuracy of the classification is 60% and the error is 40%. Accuracy and error are two key attributes of measuring how well a classification performs. When the accuracy of a classification model goes up, the error goes down.
Measuring the performance of classification models
Accuracy and error are two key metrics in classification. But you can interpret the performance of the model much more deeply if you learn more about another key metric: the confusion matrix.
The confusion matrix includes rows and columns for all possible labels in a classification:
- True positives (TP): The model correctly predicts a positive value.
- True negatives (TN): The model correctly predicts a negative value.
- False positives (FP): The model incorrectly predicts a positive value.
- False negatives (FN): The model incorrectly predicts a negative value.
Each cell in the confusion matrix contains the number of instances that are classified in a certain way. We’re most interested in getting true positives and true negatives: this means our classification model is working properly. A greater number of false positives and false negatives will decrease the accuracy of the model.
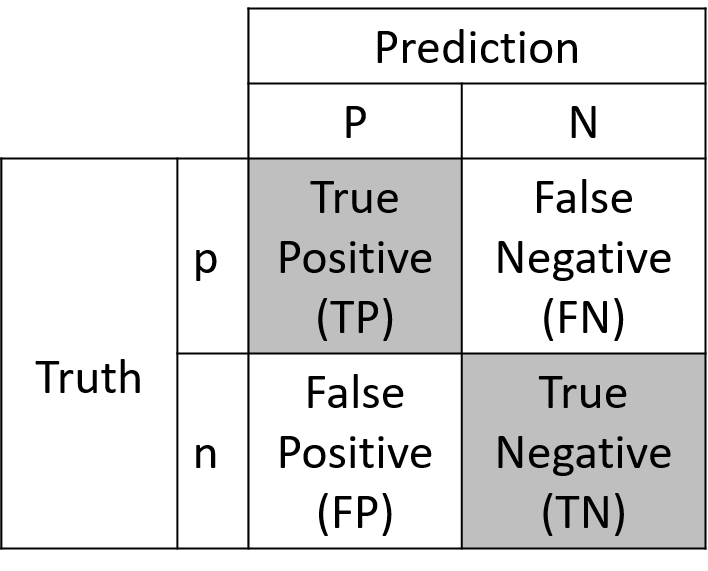
A confusion matrix.
Using the confusion matrix, the accuracy can be calculated as the number of correct predictions divided by the total number of predictions made in the data set:
\[{Accuracy}=\frac{TP+TN}{TP+TN+FP+FN}\]
Using the confusion matrix, the accuracy and error (1 - accuracy) measure how well the classification performed.
Predicting alive and dead trees
Say for example we have a data set with tree diameters and heights from an even-aged plantation. We also know whether or not these trees are alive or dead. Alive trees would likely have large diameters and tall heights.
Dead trees would likely be smaller in diameter and shorter in height. As dead trees remain standing, through time their tops and branches will fall off and the stem will break, making them shorter.
We might have a classification model that categorizes 16 different trees as being alive based on their diameter and height. Short trees with small diameters are mostly categorized as not alive (dead), indicated by everything to the left of a “prediction” line. Large diameter trees that are tall are alive, indicated by everything to the right of the line:
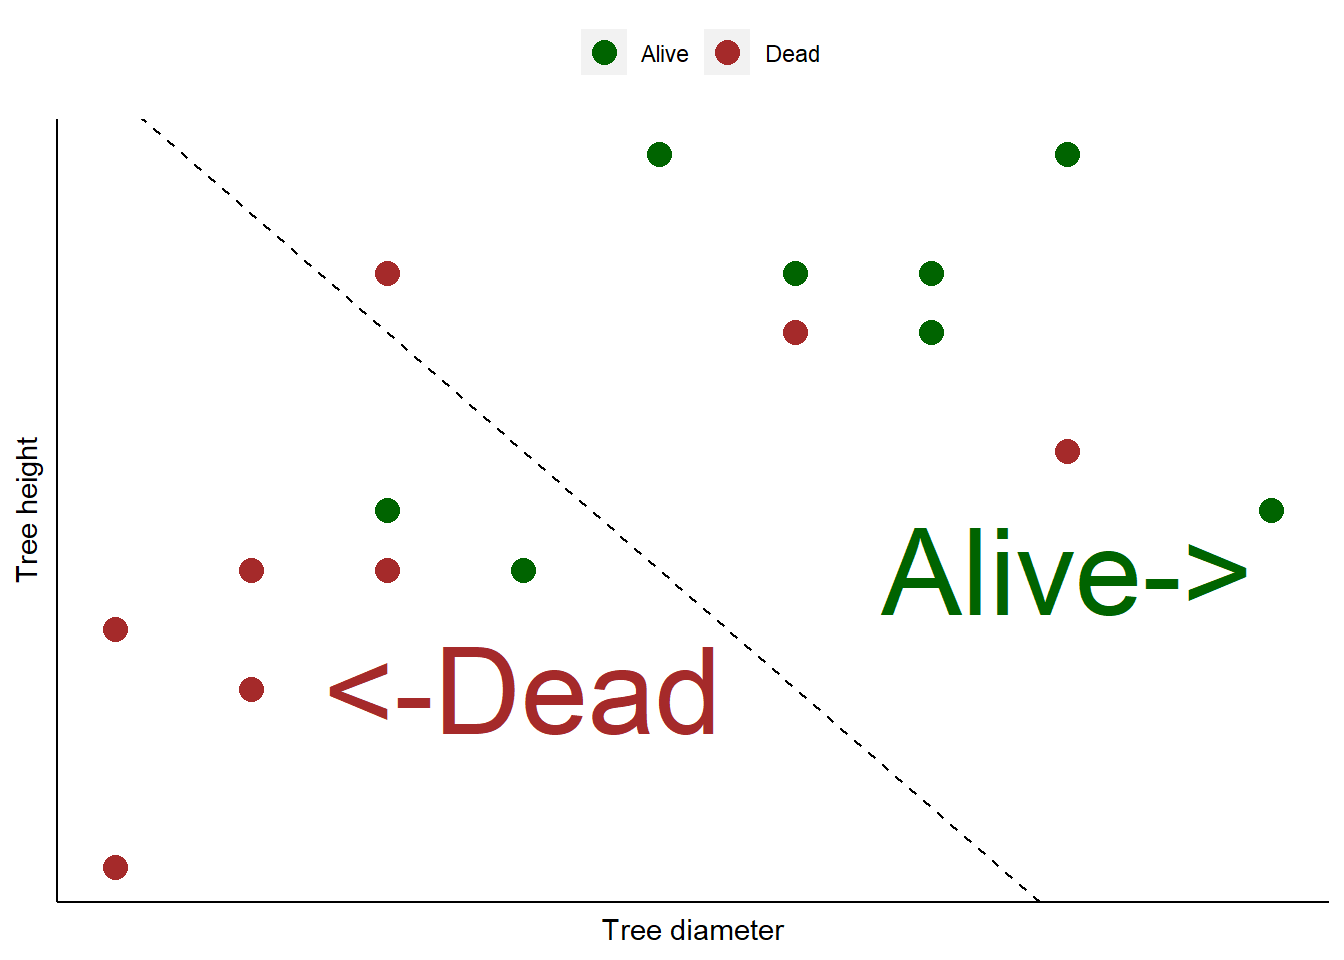
You can see that the model does a fairly good job of categorizing the trees as alive or dead. But there are three dead trees that were predicted as alive. Plus, two alive trees were predicted as dead.
We can use the data to draw the confusion matrix:
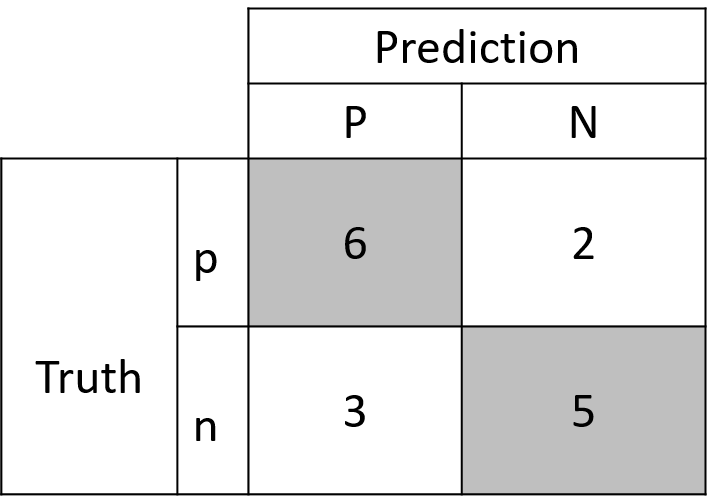
The confusion matrix for the alive/dead trees.
Using the values in the confusion matrix, we can also calculate the accuracy of the model:
\[{Accuracy}=\frac{6+5}{6+5+3+2}=68.75%\]
So, with a 68.75% accuracy, our model can predict an alive or dead tree correctly about two-thirds of the time. That might do well for our application. Or maybe we want to train a new model to increase its accuracy.
Understanding both the confusion matrix and the accuracy gives tremendous insight into the classification problem. For example, training new models might be needed if you find your model is predicting too many false positives or false negatives.
Conclusion
Classification is a widely used algorithm with many applications in forestry. Three key things to understand with any classification model are the confusion matrix, the accuracy, and the error. Useful accuracy values in forestry tend to be greater than 80%, or correctly predicting an attribute in at least four out of every five classifications.
By Matt Russell. Leave a comment below or email Matt with any questions or comments.