New logging companies with old equipment: Finding patterns in logging businesses using clustering
An example of using machine learning in the forest products industry.
Data science Machine learning clustering k-means logging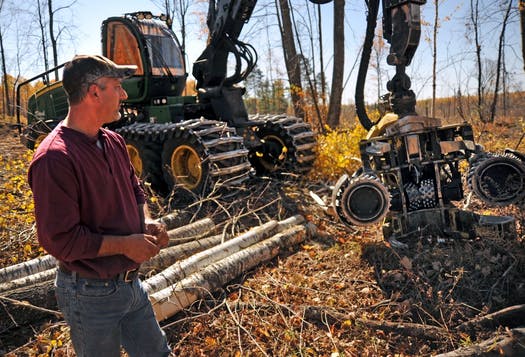
Loggers are the backbone of the forest products industry and contribute to the 2.5 million jobs in the US that forests provide. Despite their importance to the industry, many studies have highlighted the challenges that loggers face with regard to economic markets, changing demographics, and an unhealthy outlook on the profession.
As an example in Minnesota, a recent study indicated that the average age of logging businesses continues to grow older, with a third of loggers more than 60 years old. In that same study, loggers failed to identify any factors that would encourage others to join the logging profession.
The age of a logging business is likely related to other demographics such as the amount of wood volume produced by a logger, how much revenue the business takes in, and the kind of equipment used by the logger. We can use clustering to help us find patterns or groups within the Minnesota logger data.
Clustering as a way to find patterns
Clustering is an unsupervised machine learning algorithm that groups items in clusters. Data points that get grouped in the same cluster, by way of any number of clustering algorithms, are similar in nature. The process of clustering allows us to recognize patterns that might appear in the data, without needing to analyze it through detailed quantitative analysis.
K-means clustering is an algorithm that designates k groups, each with a mean value of that group. Each ‘k-mean’ is selected so that the amount of variation within a cluster is smallest. (Or in statistical terms, the the total within sum of squares is minimized.)
We can use k-means clustering on the Minnesota logger data to find patterns in business characteristics.
The Minnesota logger data
The logger data contain two key variables: The age of a company’s newest feller buncher (the most common piece of equipment used to harvest wood in Minnesota) and the number of years the logging company has been in business.
One might suppose that established logging businesses may have newer equipment because of their time in their market (up to 80 years in this data set) has made them a successful company. Young companies may be working with older equipment because they have yet to build up the capital required to purchase new equipment.
The data contain 78 observations from Minnesota loggers. Here’s a scatter plot of the age of feller buncher and years the logging company has been in business:
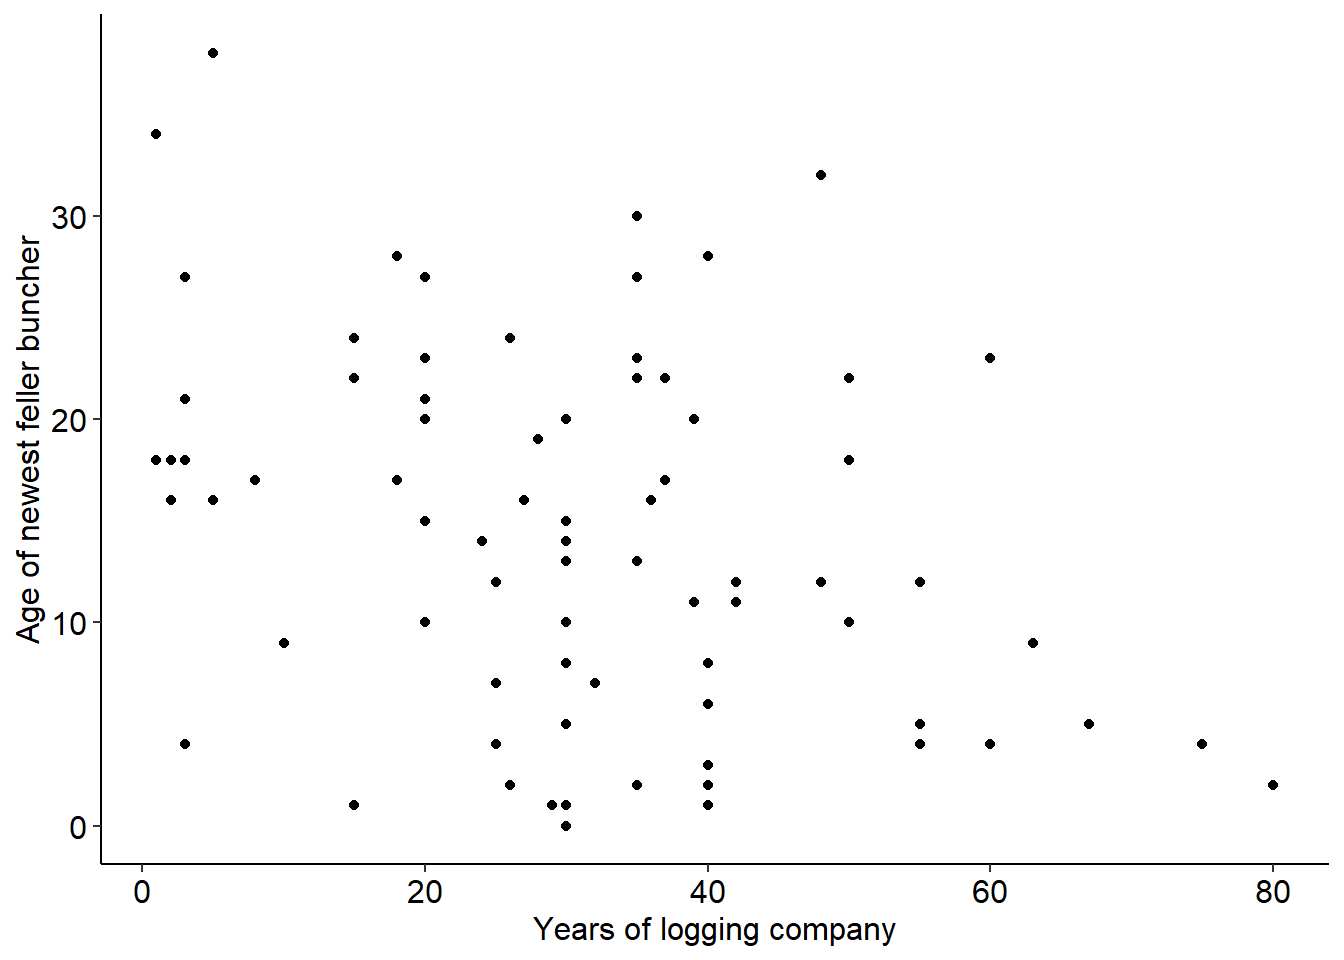
You’ll notice a slight negative correlation between the two variables. The correlation coefficient is -0.33, indicating that established logging companies that have existed for a long time generally have newer equipment.
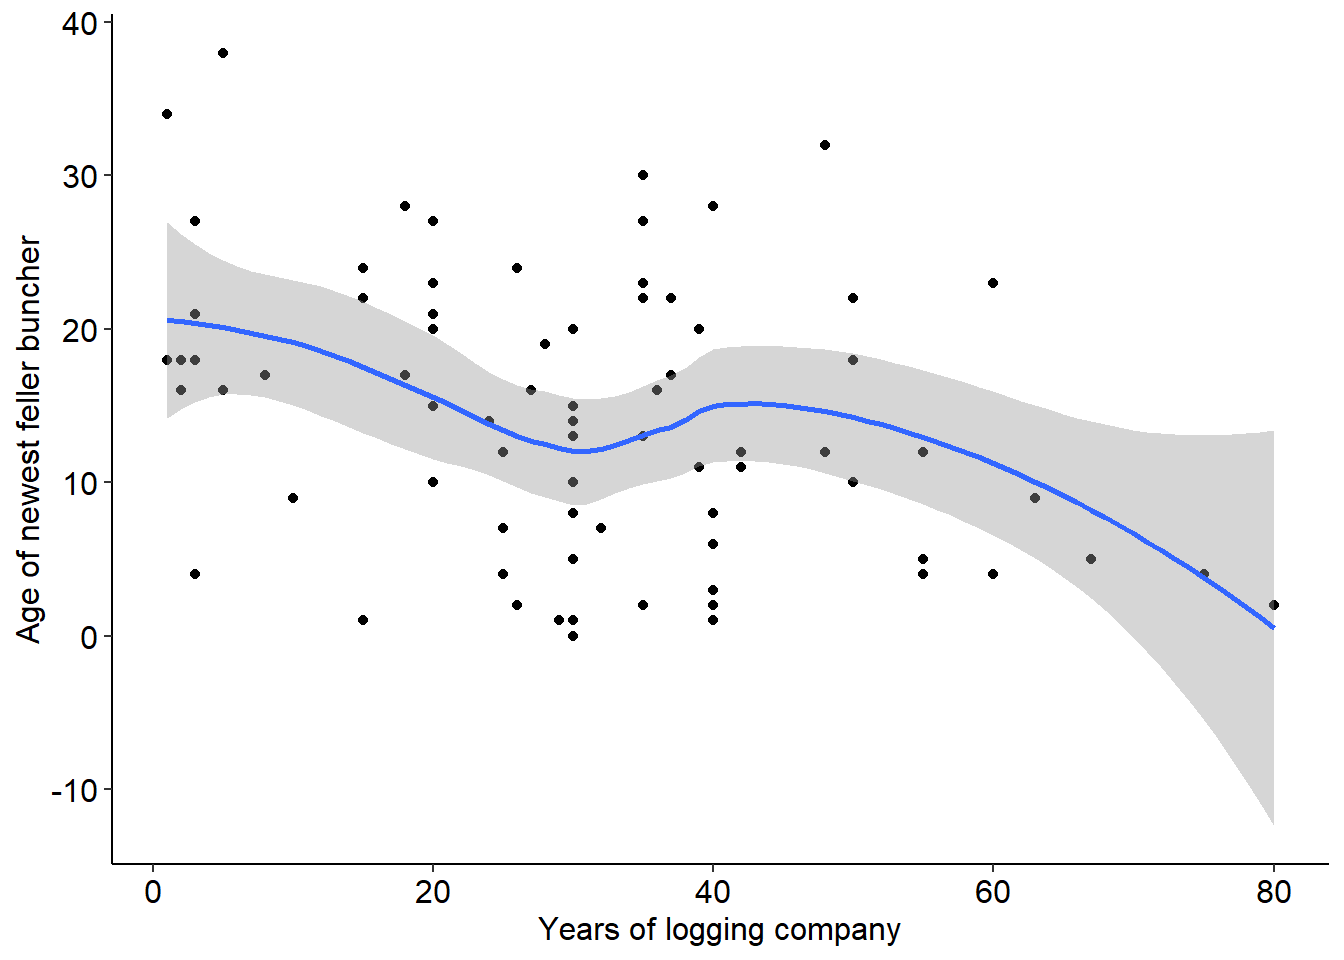
We can add a smoothed trend line (blue) with 95% confidence intervals (gray), and also see that generally younger logging companies have older pieces of equipment:
Clustering logging businesses
So what patterns might emerge if we _grouped__ the data using k-means clustering? Young logging companies with old equipment may be one group, and old companies with new equipment might be another.
We’ll start with trying four clusters using the logging business data, and the factoextra package in R 1. The graph shows a separation of four groups:
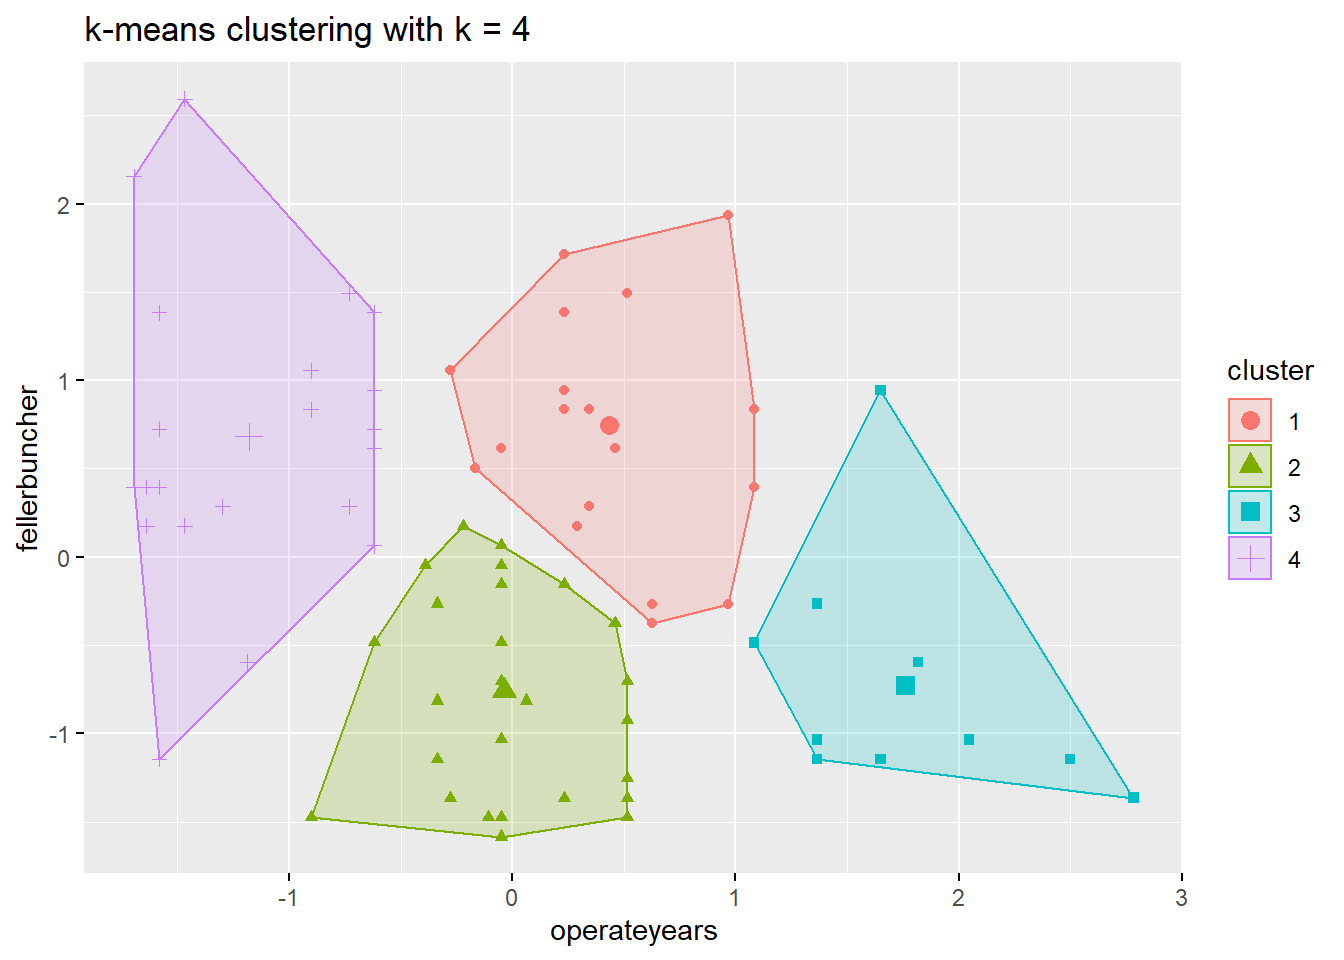
The k-means clustering approach also can provide mean values for the years of the logging company and the age of the newest feller buncher, summarized for each cluster.
Investigating each cluster provides insight into each group that emerges:
- Established companies, new equipment (far right). These are established companies that are working with new logging equipment. They have a long history and likely have strong relationships with landowners that supply the wood that they harvest.
- Younger companies, new equipment (middle, bottom). These are younger companies that are working with new logging equipment. They likely have solid growth opportunities as a company because their equipment can lead to efficient harvesting of wood and increased in-woods productivity.
- Older companies, older equipment (middle, top). These are older companies that are working with relatively old logging equipment. These loggers may be at the greatest risk of market changes: they have not invested in capital expenditures in their equipment, yet likely have established relationships with landowners that provide wood for harvest.
- Young companies, old equipment (far left). These are young companies that do not have a long history and are working with old logging equipment. They may be seeking to establish relationships with landowners.
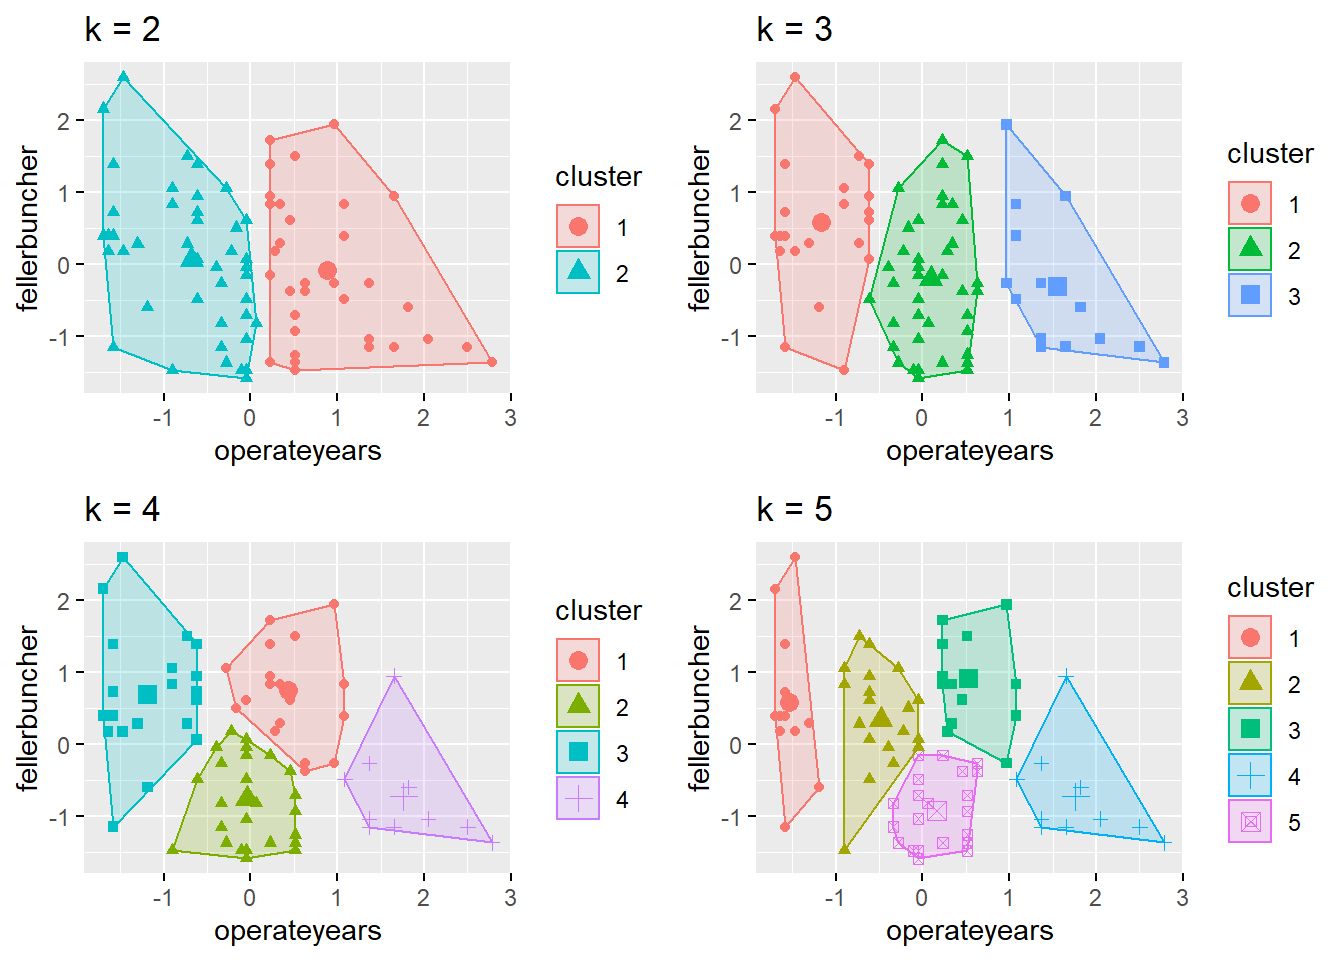
An analyst can choose any number of clusters to use in k-means clustering. There are a number of ways to identify the appropraite number of clusters for a data set. For example, we could have chosen to identify between two and five clusters:
Summary
Clustering is a useful method to quickly identify patterns within data. The advantage is that data do not have to be labeled in any way–the clustering can do they work in grouping data. As an example, for the cluster that identifies older companies working with relatively old logging equipment, additional analysis of those businesses can identify other demographics of those logging companies such as: * their outlook on the profession, * how many employees they have, * and how much wood volume they produce.
More “quantitative analysts” may not see as much value in clustering due to the minimal amount of quantitative output that clustering provides (aside from the mean values of each variable within each cluster). Mean values provided in a cluster analysis may help to set thresholds that can be used in subsequent analyses, e.g., how do we define a “new logging business” or one that works with “old equipment”?
By Matt Russell. Leave a comment below or email Matt with any questions or comments.
Alboukadel Kassambara and Fabian Mundt (2017). factoextra: Extract and Visualize the Results of Multivariate Data Analyses. R package version 1.0.5.↩