Random forests in a nutshell
September 19, 2020
analytics random forests classification Machine learning Data scienceRandom forests have exploded in popularity in the forestry discipline in recent years. Random forests (RF) are a quantitative tool categorized as a machine learning technique. Analysts prefer to use RF methods because they can handle large amounts of data, provide the relative importance of a many variables, and can be applied to classification or regression problems.
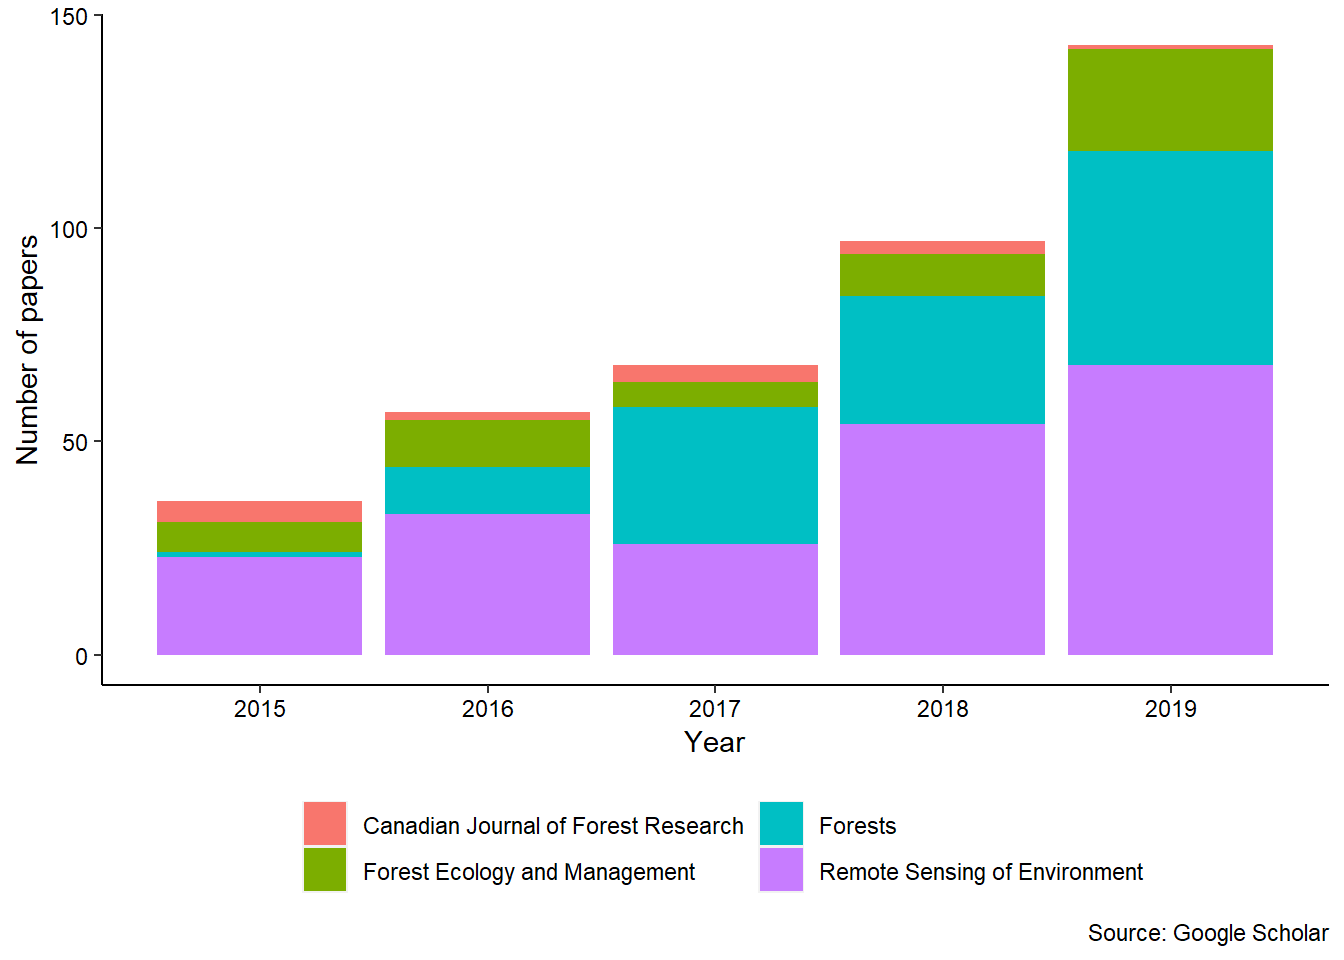
The following graph shows the number of articles from four common journals in the forestry discipline that contained the term “random forests” in the article. The use of RF methods has grown in the last several years:
How do random forests work?
First, several small samples of the entire data set are taken. Any observations that are not taken are called “out-of-bag” samples.
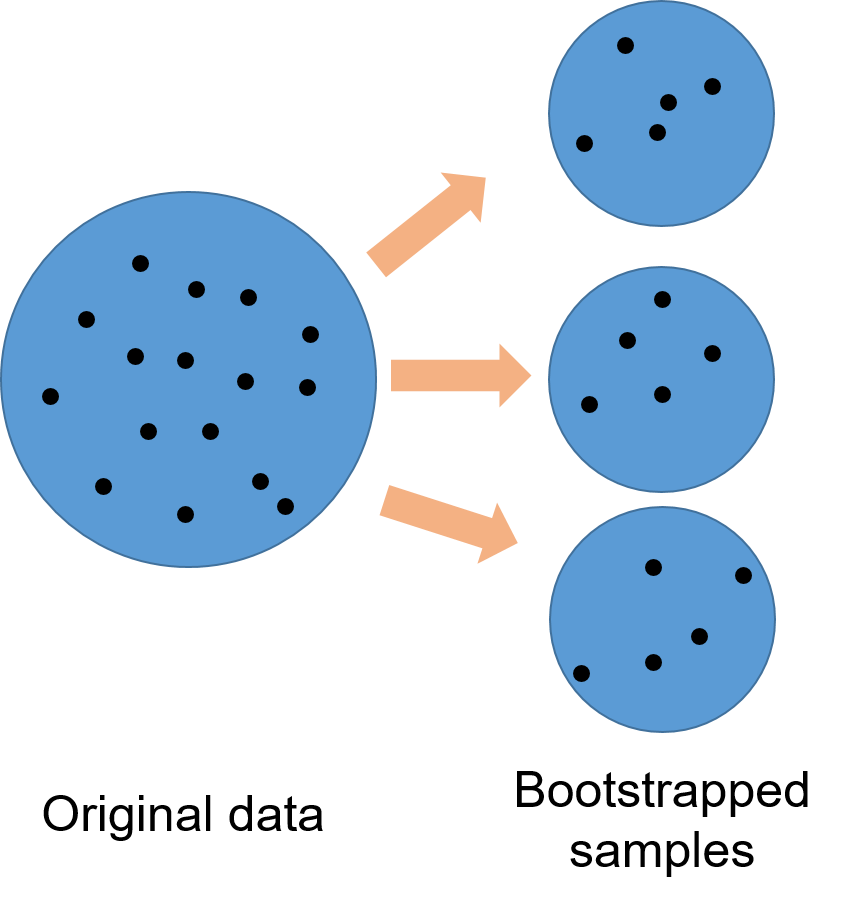
Bootstrapped samples from random forests.
Random forests methods work well for response variables and models of various kinds. For example, the problem could involve classification (e.g., whether a tree is alive or dead) or regression (e.g., the height of a tree). After the bootstrapped samples are drawn, a set of regression trees are built.
Then, the mean square error (MSE) is calculated for each regression tree using the out-of-bag samples for that tree. After all of those calculations, the MSE is averaged across all regression trees.
What is the key output from random forests?
Many studies in forestry contain dozens, if not hundreds, of potential predictor variables. Each variable in an RF model will contain an importance score. The importance score is calculated by evaluating the regression tree with and without that variable. When evaluating the regression tree, the MSE will go up, down, or stay the same.
If the percent increase in MSE after removing the variable is large, it indicates an important variable. If the percent increase in MSE after removing the variable is small, it’s less important.
In a forestry example, Deo et al. 2017 used random forests to evaluate hundreds of remote sensing variables from a Landsat time-series and lidar. The authors identified several remote sensing variables that led to estimates of change in forest aboveground biomass:
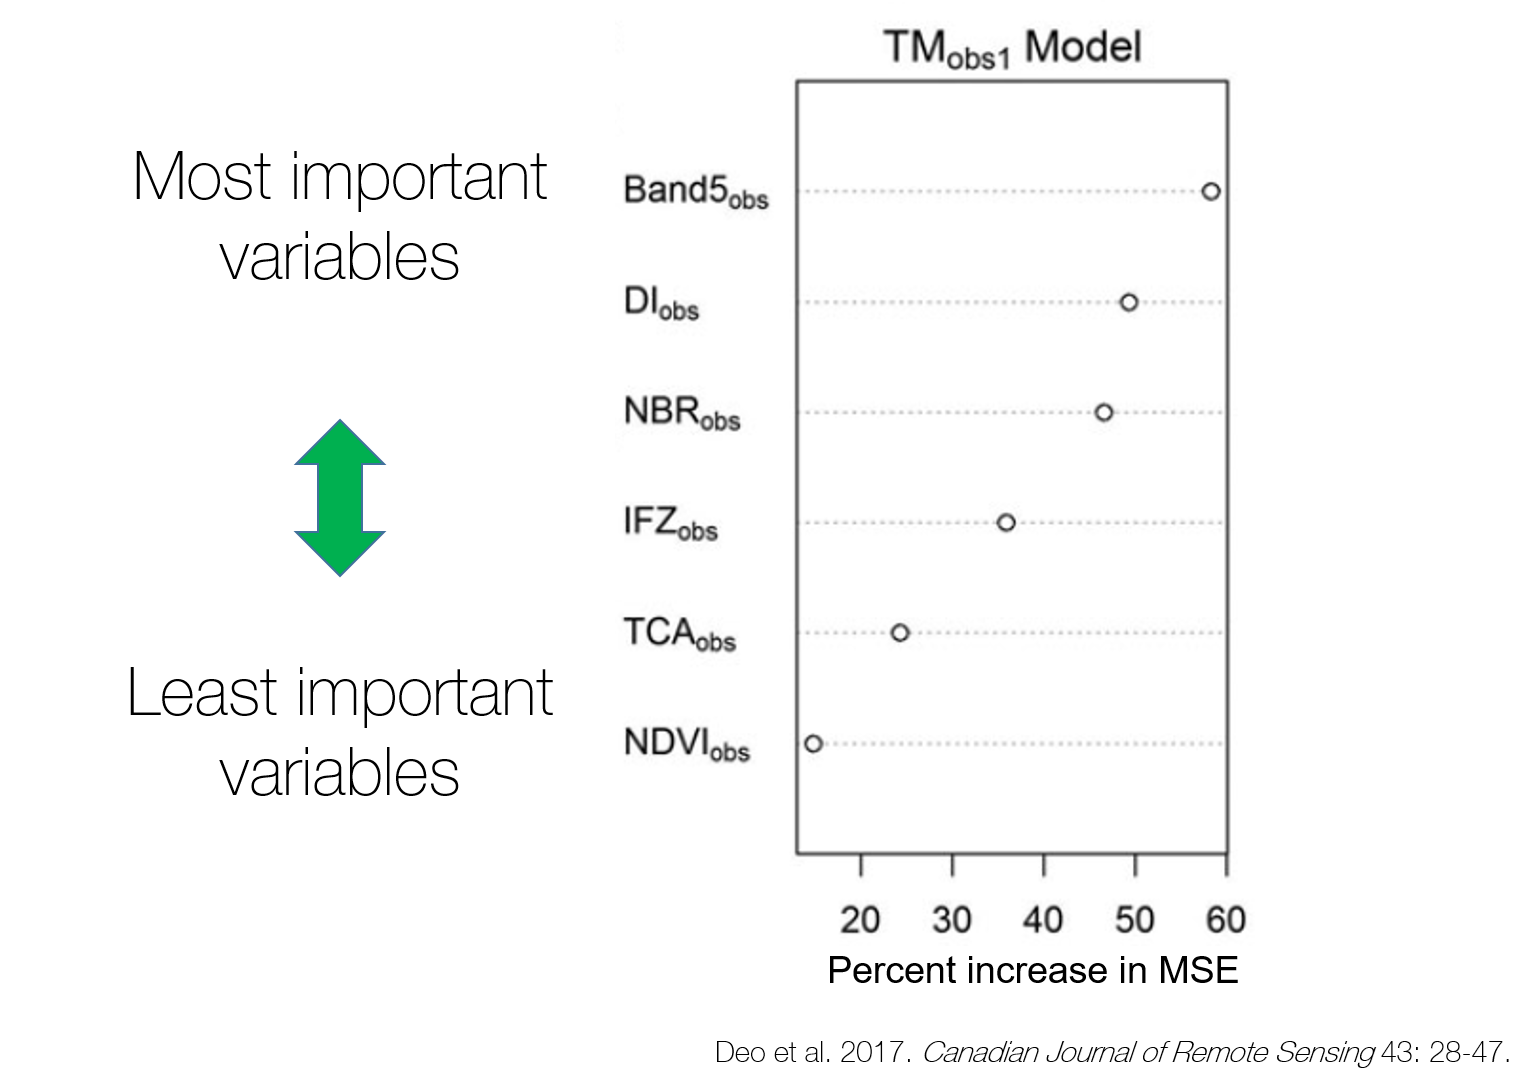
Variables are ranked from most to least important in random forests output.
What are the strengths and limitations of random forests?
The strengths of random forests include:
- They can handle all types of data (e.g., categorical, continuous).
- They often perform similarly or better than regression methods.
- They work well with data sets containing a large number of predictor variables.
The limitations of random forests include:
- They are often considered a “black box” method because models are not easily interpreted.
- They require extensive model tuning for the best results.
Conclusion
Random forests are powerful and versatile with forestry data because they only use a random subset from a large data set. These methods have increased in popularity in recent years and can be applied to a variety of classification and regression problems.
A random forests reading list
The classics
- Breiman, L. 2001. Random forests. Machine Learning, 45(1): 5–32.
- Liaw, A. and M. Wiener. 2002. Classification and regression by randomForest (PDF). R News 2(3): 18-22.
Applications in forestry
Weiskittel, A.R., N.L. Crookston, and P.J. Radtke. 2011. Linking climate, gross primary productivity, and site index across forests of the western United States. Canadian Journal Forest Research 41: 1710-1721.
Deo, R.K., M.B. Russell, G.M. Domke, C.W. Woodall, M.J. Falkowski, and W.B. Cohen. 2017. Using Landsat time-series and LiDAR to inform aboveground forest biomass baselines in northern Minnesota, USA. Canadian Journal of Remote Sensing 43: 28-47.
How to run random forests in R
A very basic introduction to Random Forests using R (Oxford Protein Informatics Group)
How to implement Random Forests in R (R-Bloggers)
–
By Matt Russell. Sign up for my monthly newsletter for in-depth analysis on data and analytics in the forest products industry.