Ruffed grouse and West Nile: A review of the binomial distribution
November 27, 2019
binomial statistics ruffed grouse sampling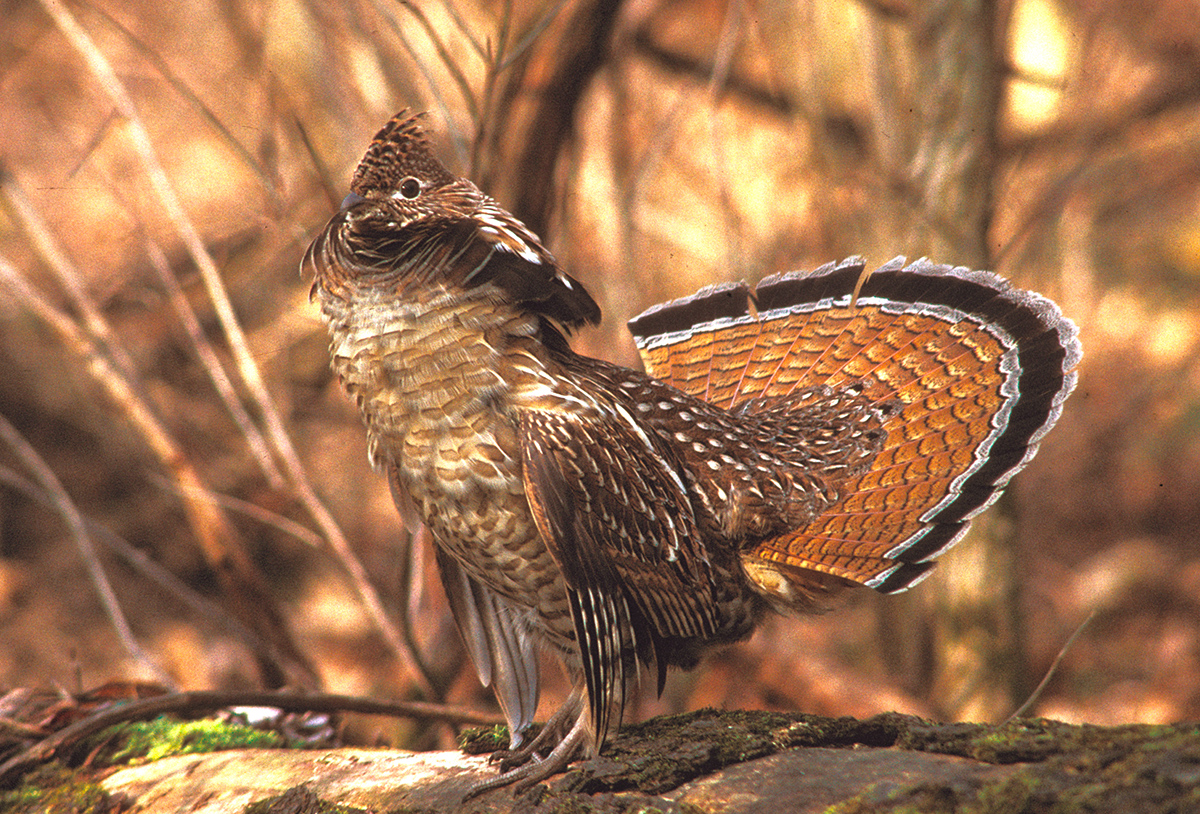
There’s been a lot of talk in the wildlife community about the West Nile virus and its impacts on ruffed grouse populations.
In 2018, a multi-state effort examined the presence of West Nile virus in ruffed grouse populations across the US Lake States. The study concluded that while the West Nile virus was present in the region, grouse that are exposed to West Nile do not always die and can survive. Ruffed grouse populations in this region are cyclical, with a recent peak in populations in Minnesota in 2017. Wildlife biologists are interested in knowing how West Nile impacts grouse and these peaks in populations.
The ruffed grouse-West Nile data set
The total number of ruffed grouse sampled in each of the three states, and those that showed antibodies consistent with West Nile virus is shown in the table below:
| State | Number of grouse sampled | Number of grouse with West Nile | Proportion of grouse with West Nile |
|---|---|---|---|
| Michigan | 213 | 28 | 0.13 |
| Minnesota | 273 | 34 | 0.12 |
| Wisconsin | 235 | 68 | 0.29 |
These tests found a much smaller number of birds that had West Nile in their hearts, indicating that the grouse were mostly healthy when they were sampled.
The binomial distribution
Using the grouse data, we can think of whether or not a grouse has West Nile as a Bernoulli trial. If a group of grouse are sampled, some number of them may have the West Nile virus, and we have a binomial distribution.
Flipping a coin and observing whether it’s a heads or tails is an example of a Bernoulli trial. With a fair coin, the probability p of getting a heads is p = 0.5. The Bernoulli distribution is the simplest discrete distribution, and is the foundation for other more complicated discrete distributions.
A binomial distribution is a sum of Bernoulli trials. It is measured by the count of successes (X) with parameters n and p, where:
n is the number of trials of the chance process,
p is the probability of a success on any one trial, and
The possible values of X are the whole numbers from 0 to n.
If a count has a binomial distribution with n trials and probability of success p, the mean can be determined as np and the standard deviation as np(1-p).
The formula for finding the probability of exactly x successes is:
\[{P(X=x)}=\frac{n!}{x!(n-x)!}{p^x}{(1-p)}^{n-x}\] As an example, consider a random sample of six grouse from Michigan. What is the probability that none of these grouse will have the West Nile virus? The problem can be solved with:
\[{P(X=0)}=\frac{6!}{0!(6-0)!}{0.13^0}{(1-0.13)}^{6-0}=0.4336\]
Or, there would be about a 43% chance that if you sampled six grouse from Michigan, none of them would have West Nile.
Below shows a visualization of sampling n = 6 ruffed grouse from Michigan and calculating the probability of each possible number of grouse being infected with West Nile:
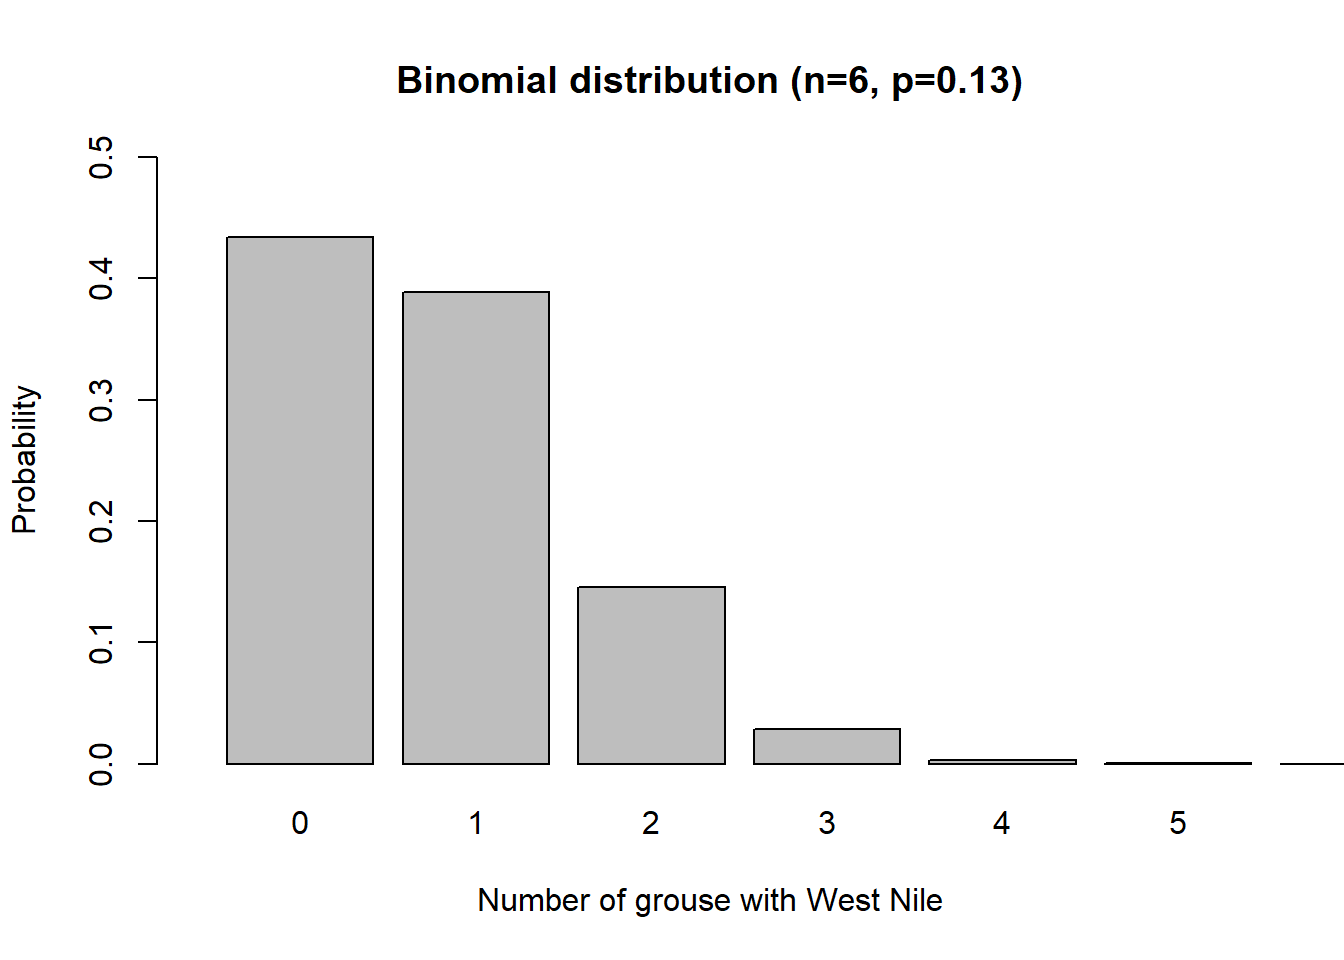
We can see that if six birds are sampled, the most probable outcome is that zero ruffed grouse will have West Nile.
Now we can sample ruffed grouse from Michigan with n = 60. The probability of a grouse infected with West Nile is the same as the previous graph (p = 0.13), but what do you notice about the distribution when n = 60?
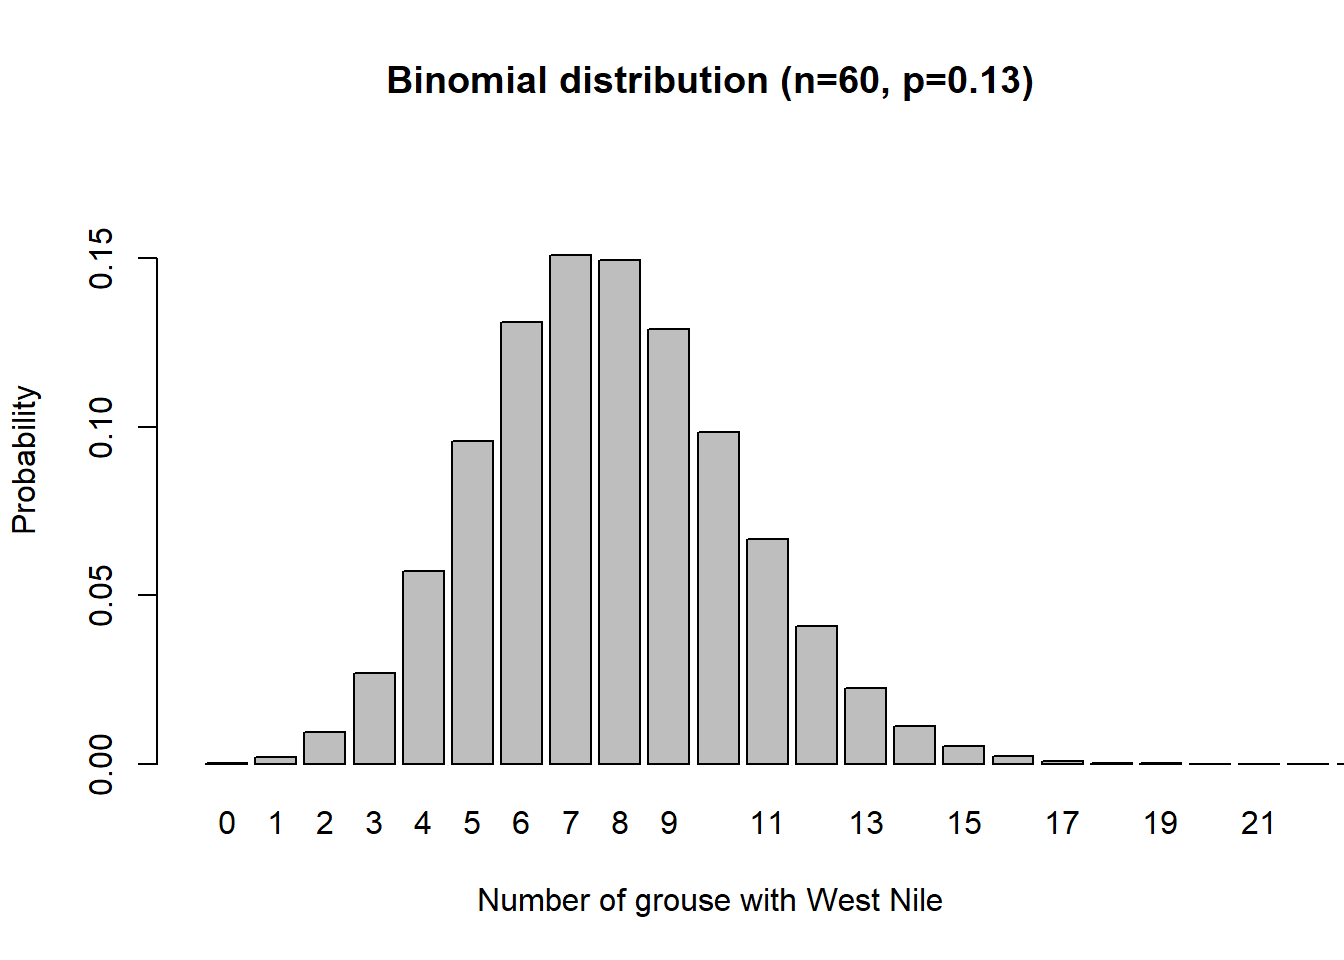
First, we can see that if 60 birds are sampled, it is most likely that around eight of them will have West Nile. Second, as n gets larger, something interesting happens to the shape of a binomial distribution: it looks more like a normal distribution.
The normal approximation can be applied to binomial distributions when n gets large. As a general rule of thumb, the normal approximation can be used when n is so large that \(np \ge 10\) and \(n(1-p) \ge 10\).
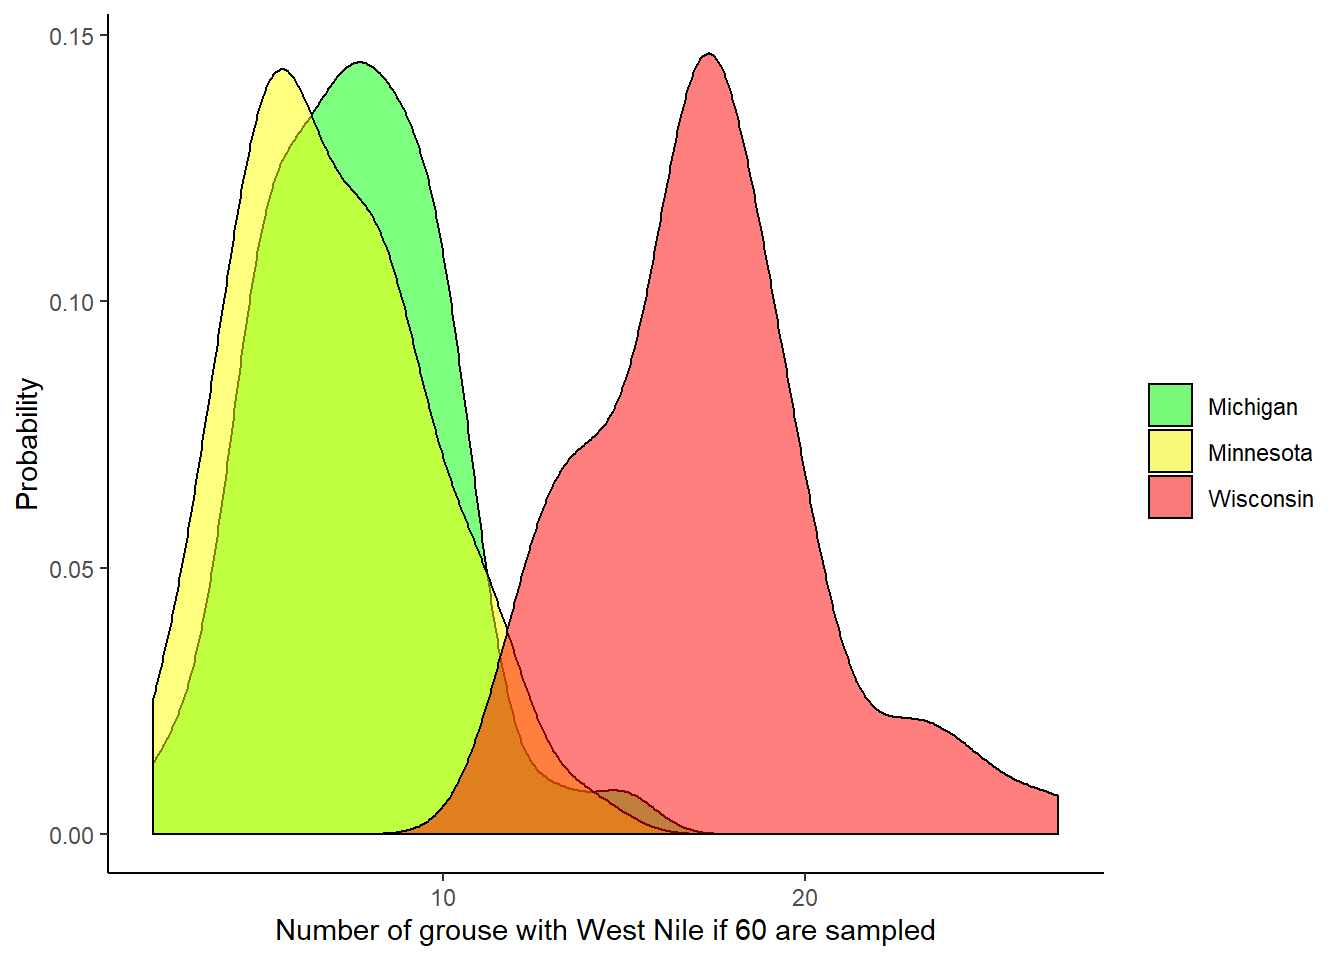
We can also visualize the differences in West Nile presence across the three states. The following visualization assumes that 60 grouse are sampled and shows the differences in West Nile presence:
Conclusion
The binomial distribution is a sum of Bernoulli trials. The binomial is measured by the count of successes X (e.g., the number of “successful” ruffed grouse where West Nile was confirmed) with parameters n (the total number of birds sampled) and p (the probability a bird has West Nile). As we can see from the ruffed grouse example, the binomial distribution is a handy one that has a number of applications across natural resources.
By Matt Russell. Leave a comment below or email Matt with any questions or comments.