States with the biggest gains in forest carbon over the last 30 years
September 7, 2020
analytics carbon forest inventory forestryTrees and forests sequester carbon dioxide and other greenhouse gases from the atmosphere. This makes them a natural climate solution. This also encourages managers to quantify carbon attributes along with the myriad of other benefits that forests provide.
The value of carbon in forests has seen a tremendous increase in recent years. The increase in voluntary forest carbon markets have required analysts to have a better understanding of carbon attributes in the forests they work in. Initiatives such as the Trillion Trees Campaign have garnered international attention as it seeks plant trees for the carbon benefits they provide.
Despite the increasing importance of understanding the amount of carbon that forests can store and sequester, easy-to-access information at the state level has historically been difficult to obtain. As it’s said, all forest management is local.
Last spring, the USDA Forest Service published “Greenhouse gas emissions and removals from forest land, woodlands, and urban trees in the United States, 1990-2018”. For the first time, detailed estimates were provided for each US state, including forest carbon storage, net flux of carbon, and carbon stored in different pools. In the USDA report, forest carbon pools include:
- aboveground biomass,
- belowground biomass,
- dead wood,
- litter,
- soil (mineral), and
- soil (organic)
The report provides annual trends in forest carbon stocks dating back to 1990 for each US state. The year 1990 is the benchmark to which most carbon emissions analyses are based, coinciding with early targets set forth in the Kyoto Protocol.
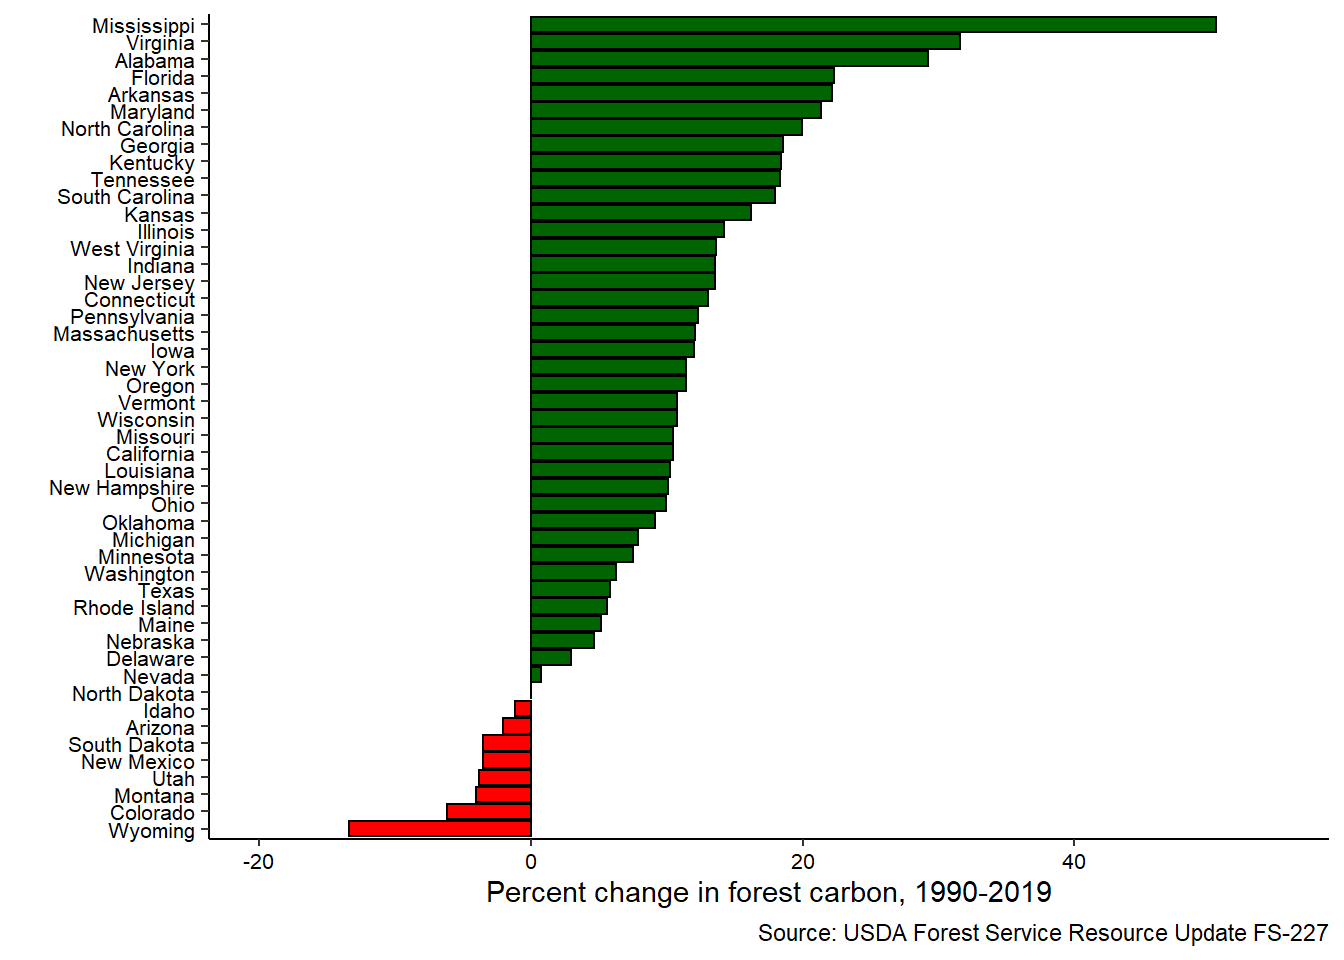
Southeastern states have seen the greatest gains in forest carbon
Forest carbon stocks in the state of Mississippi have increased by 50.4% since 1990, from 823 to 1238 million metric tonnes (MMT). Eleven of the states with the greatest gains in forest carbon are located in the southeastern US (including Maryland).
In total, 39 US states have seen overall forest carbon gains since 1990. (Carbon stocks in North Dakota remained the same over this time period.) Forest carbon stocks in Mississippi also had the largest total increase in forest carbon stocks, followed by Oregon (an increase of 326 MMT) and Alabama (an increase of 318 MMT).
Western states have seen the greatest losses in forest carbon
The greatest percent loss in forest carbon was in Wyoming. Forest carbon stocks in Wyoming decreased by 13.4% since 1990, from 529 to 458 MMT. All other states that saw losses in forest carbon since 1990 are located in the western US.
In total, eight US states have seen overall forest carbon losses since 1990. Aside from Wyoming, all other losses were in the single percentage points. Forest carbon stocks in Colorado had the largest total decrease in forest carbon stocks (a decrease of 81 MMT) followed by Montana (a decrease of 79 MMT).
| State | Forest carbon in 1990 (MMT) | Forest carbon in 2019 (MMT) | Percent change, 1990-2019 |
|---|---|---|---|
| Mississippi | 823 | 1238 | 50% |
| Virginia | 979 | 1288 | 32% |
| Alabama | 1089 | 1407 | 29% |
| Florida | 851 | 1041 | 22% |
| Arkansas | 947 | 1157 | 22% |
| Maryland | 192 | 233 | 21% |
| North Carolina | 1198 | 1437 | 20% |
| Georgia | 1240 | 1470 | 19% |
| Kentucky | 750 | 888 | 18% |
| Tennessee | 880 | 1041 | 18% |
| South Carolina | 708 | 835 | 18% |
| Kansas | 142 | 165 | 16% |
| Illinois | 303 | 346 | 14% |
| West Virginia | 970 | 1102 | 14% |
| Indiana | 324 | 368 | 14% |
| New Jersey | 155 | 176 | 14% |
| Connecticut | 169 | 191 | 13% |
| Pennsylvania | 1421 | 1596 | 12% |
| Massachusetts | 290 | 325 | 12% |
| Iowa | 192 | 215 | 12% |
| New York | 1715 | 1911 | 11% |
| Oregon | 2860 | 3186 | 11% |
| Vermont | 427 | 473 | 11% |
| Wisconsin | 1049 | 1162 | 11% |
| Missouri | 898 | 992 | 10% |
| California | 2756 | 3044 | 10% |
| Louisiana | 792 | 873 | 10% |
| New Hampshire | 437 | 481 | 10% |
| Ohio | 555 | 610 | 10% |
| Oklahoma | 602 | 657 | 9% |
| Michigan | 1421 | 1533 | 8% |
| Minnesota | 1130 | 1215 | 8% |
| Washington | 2546 | 2706 | 6% |
| Texas | 1631 | 1726 | 6% |
| Rhode Island | 36 | 38 | 6% |
| Maine | 1359 | 1429 | 5% |
| Nebraska | 87 | 91 | 5% |
| Delaware | 34 | 35 | 3% |
| Nevada | 275 | 277 | 1% |
| North Dakota | 48 | 48 | 0% |
| Idaho | 1728 | 1707 | -1% |
| Arizona | 533 | 522 | -2% |
| South Dakota | 114 | 110 | -4% |
| New Mexico | 731 | 705 | -4% |
| Utah | 647 | 622 | -4% |
| Montana | 1946 | 1867 | -4% |
| Colorado | 1305 | 1224 | -6% |
| Wyoming | 529 | 458 | -13% |
US forest carbon stocks have increased by 11% from 1990 to 2019
Forest carbon stocks across the lower 48 US states have increased from 41,814 MMT in 1990 to 46,221 MMT in 2019. Considering this area occupies 635.3 million acres of forests and is 34% forested, the gains in forest carbon in the country over the last 30 years represent a substantial increase in trees and forests sequestering carbon from the atmosphere.
–
By Matt Russell. Sign up for my monthly newsletter for in-depth analysis on data and analytics in the forest products industry.