Using Google Forms to analyze confidence intervals: a teaching statistics activity
July 14, 2019
Data viz teaching statistics moose overconfidenceThis post describes how the concepts of confidence intervals can be taught to students. The ideal participants are undergraduate students in an introductory statistics. The in-class activity reveals to students that most people are overconfident in their estimation of uncertainty. The activity uses the example of moose, a charismatic wildlife species in Minnesota.
Introduction
Demonstrations of data and statistical concepts are effective when they are designed with a structure that encourages participation in the classroom 1. Using technology to explore data and integrating real data with context are two recommendations for inclusion in introductory statistics course at the undergraduate level 2. Using technology in the classroom such as online survey tools encourages active problem-solving by students 3.
One charismatic wildlife species that is identifiable and relatable to a variety of students is moose. The Minnesota Department of Natural Resources (DNR) monitors the moose population in the state every year. Integrating technology, statistics, and moose populations in Minnesota can produce an effective activity to promote concepts of confidence intervals using a charismatic wildlife species.
The activity relies on a student-generated dataset using Google Forms and was analyzed in near-real time using the R statistical package and was subsequently discussed in class.
The activity
As a prerequisite to this activity, an introduction to the concepts of confidence intervals (CIs) was presented to students in the previous lecture. Essential concepts that were conveyed to students included: * CIs rely on some estimate of an unknown parameter in a population and a margin of error, * the student can specify a “wider” or “narrower” CI depending on the desired level of confidence, and *the proper interpretation of an 95% CI is stated that “95% of CIs calculated from many samples would contain the mean value”.
An in-class activity was developed and delivered to three different introductory statistics classes at the University of Minnesota in 2017 and 2018. In total, 76 responses were used from students in three different class periods.
In a session that discussed CIs and statistical inference more broadly, students were asked a general question at the start of the class period: how many moose are currently found in Minnesota? Using a smartphone, tablet, or laptop, students were asked to input their best guess for the current population of moose in Minnesota into a Google Form.
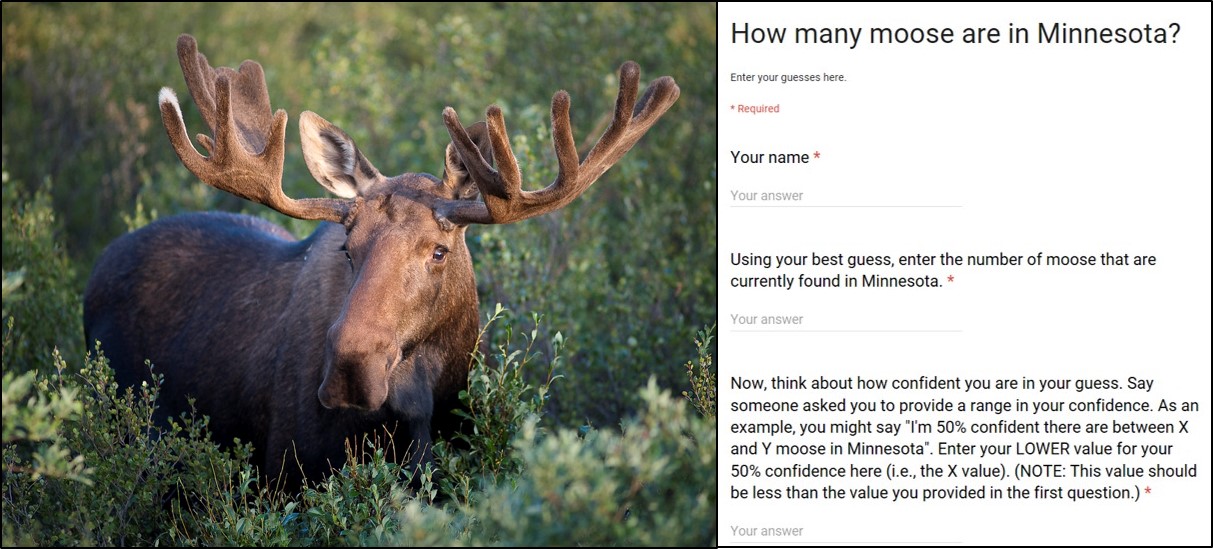
Google Form for students to enter their moose data (photo: Denali National Park and Preserve).
Then, students were asked to consider how confident they were in their guess by entering an upper and lower value for a 90% CI in response to the question “I’m 90% confident there are between X and Y moose in Minnesota”. Students were subsequently asked to provide a 50% CI for their moose population estimate. Based on the prerequisite material, students recognized that a lower confidence would correspond to a narrower interval, i.e., a 50% CI would be narrower than a 90% CI.
| Question | Mean response (number of moose) | “True” estimate (number of moose) |
|---|---|---|
| How many moose are currently found in Minnesota? | 4,460 | 3,030 |
| What is the LOWER value for your 50% confidence interval? | 2,866 | - |
| What is the UPPER value for your 50% confidence interval? | 6,011 | - |
| What is the LOWER value for your 90% confidence interval? | 1,878 | 2,320 |
| What is the UPPER value for your 90% confidence interval? | 7,784 | 4,140 |
Visualizing student confidence in moose populations
The value of collecting data through the Google Forms was that it provided an analysis-ready dataset that can be summarized during the class period. After students completed the activity, the instructor or teaching assistant summarized the data and presented it to the class. The instructor used a previously-developed R script to summarize the student’s responses and share the visualizations on the projector during the class.
Histograms were displayed to visualize the distribution of moose estimates by students. Boxplots were displayed to visualize the five-number summary of the moose population guesses, representing the minimum, first quartile, median, third quartile, and maximum values.
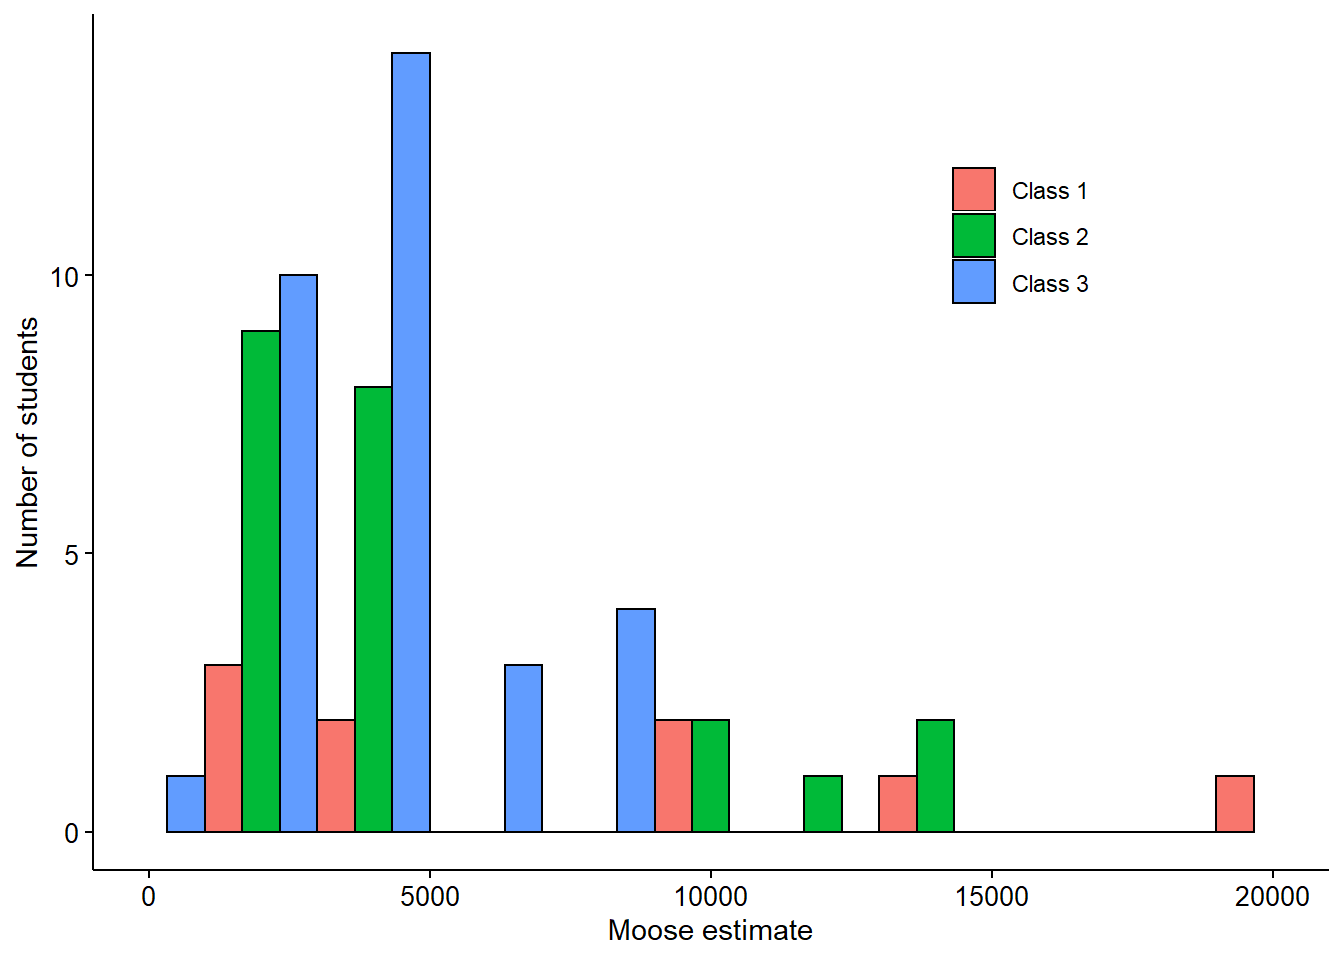
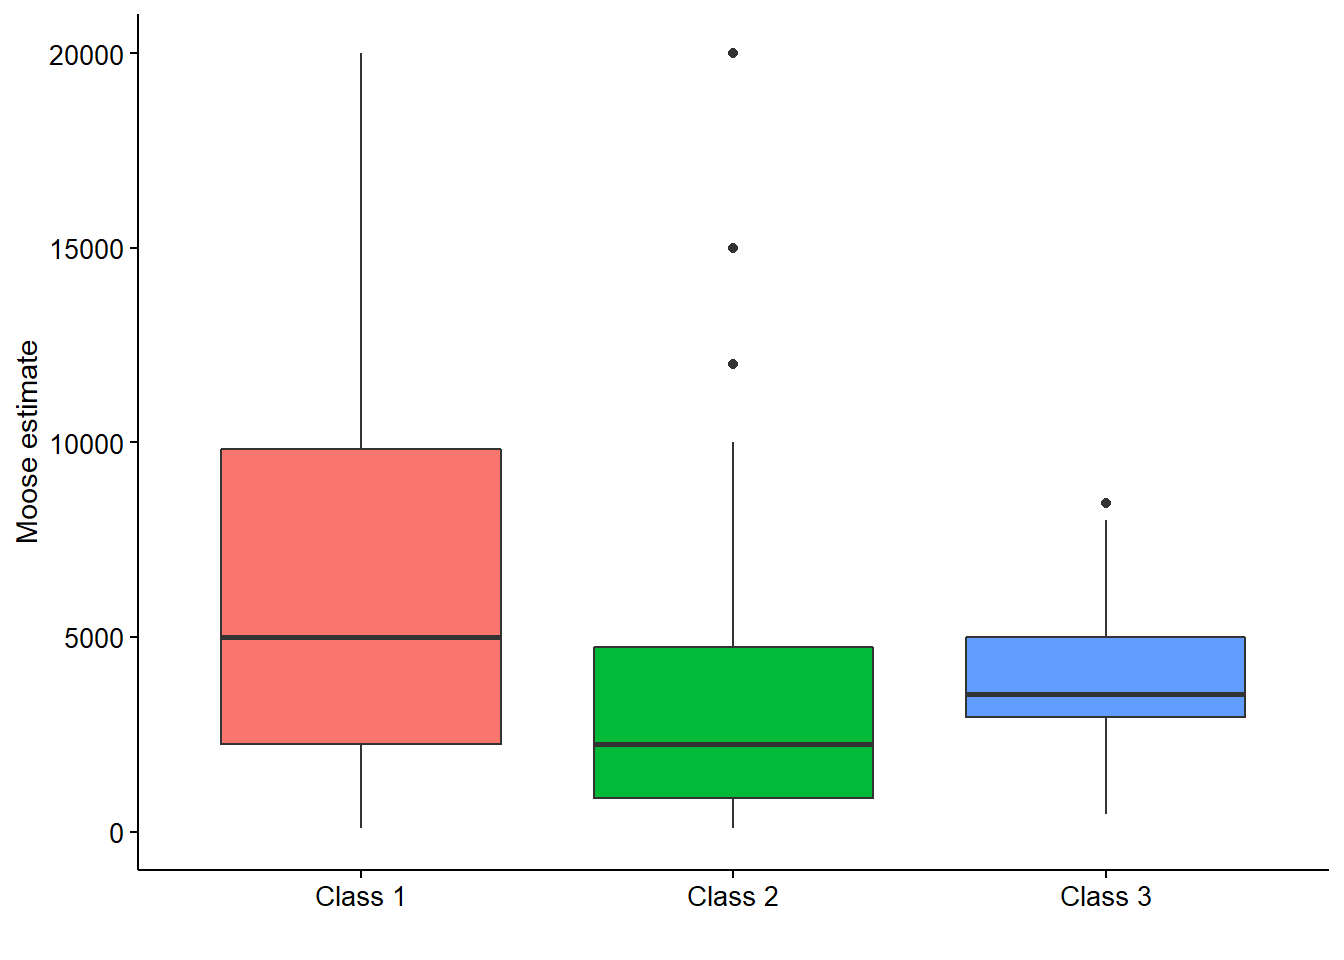
Both the histograms and boxplots indicated the class data were right skewed, with a few large estimates of moose populations. Class 1 estimated more moose relative to other classes. Classes 2 and 3 resulted in three and one outlier, respectively, from the student responses. These graphs allowed a connection between the student and the dataset, permitting introspective questions by the student such as “how does my guess compare with other students?”
We also compared the moose estimates to a “true” value for the moose population in Minnesota. Through its annual aerial survey, the Minnesota DNR used a sightability model to estimate the 2018 population to be 3,030 moose, with a 90% CI of [2,320, 4,140]. These values provided a useful comparison to the student estimates of moose populations.
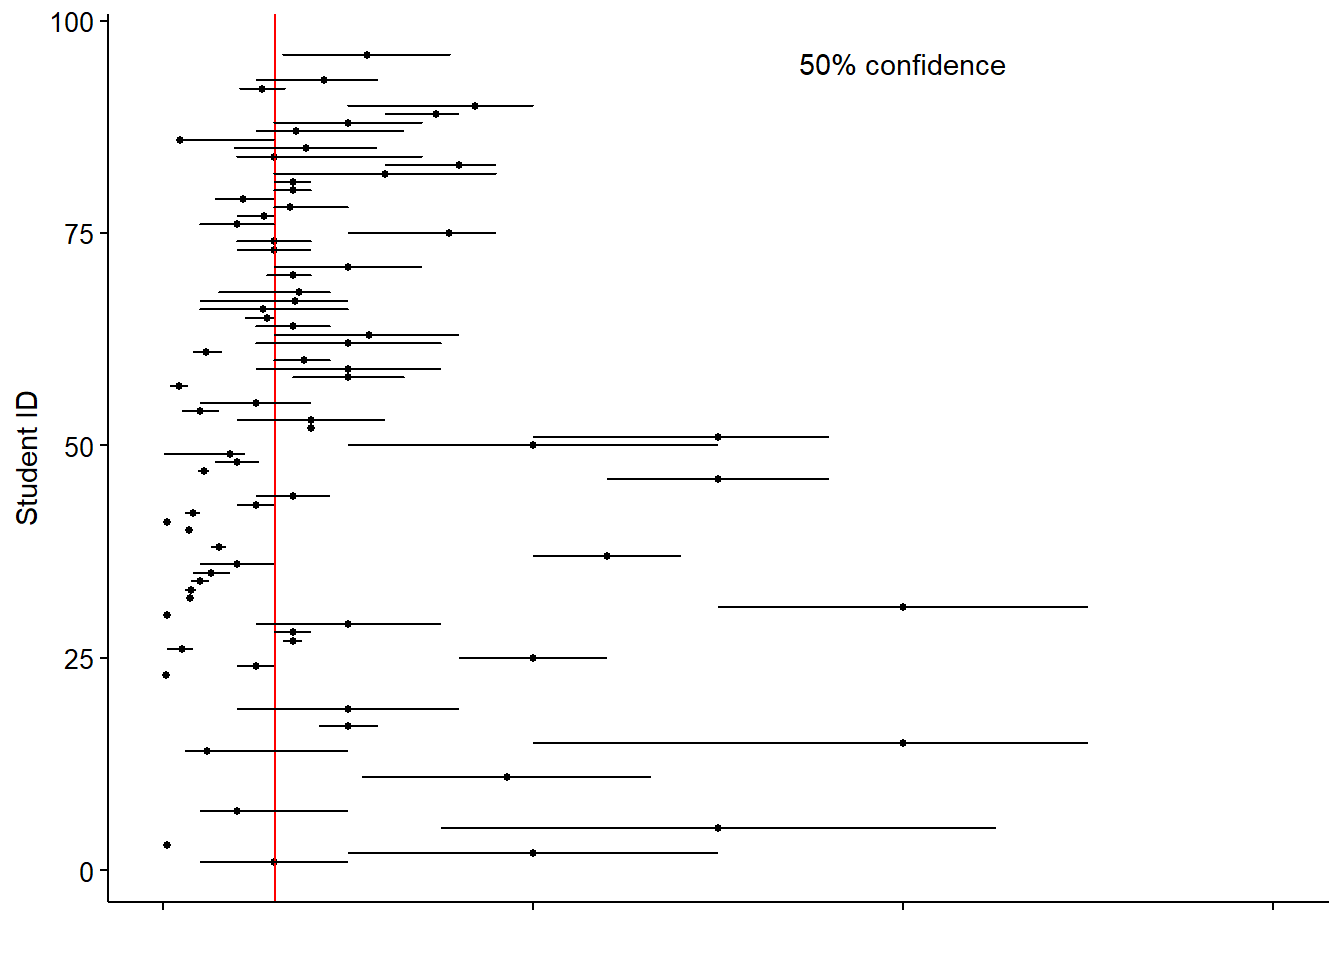
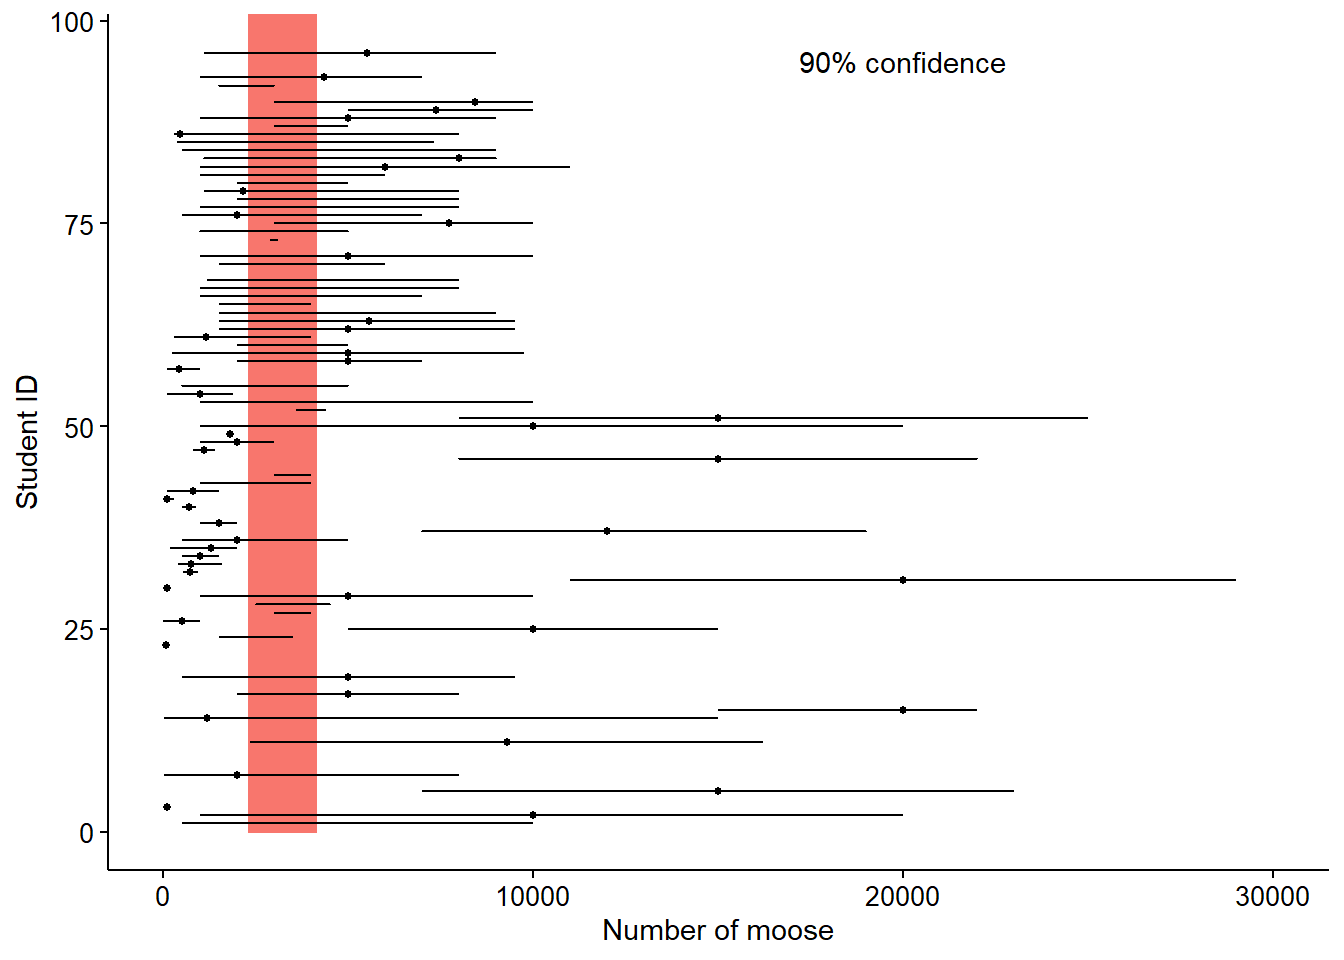
In total, 59% of students guessed a higher population (mean estimate of 18,981 moose; median estimate of 3,500 moose) compared to the “true” population determined by the Minnesota DNR (3,030 moose). Graphs of mean values and 50% and 90% CIs show the variability in student responses in comparison to the “true” population determined by the Minnesota DNR.
In sum, 38% of students guessed a 50% confidence interval that contained the true number of moose, and 55% of students guessed a 90% confidence interval that contained the true number of moose. In the figure below, means (dots) and lower and upper confidence limits (lines) at the 50% and 90% levels for estimating the number of moose in Minnesota are shown. Red line indicates the 2018 Minnesota DNR estimate based on aerial survey (3,030 moose), and shaded region indicates the DNR-estimated 90% confidence interval (2,320-4,140 moose).
In summary, student estimates of CIs were too narrow, which implies that students were “too sure” or “too confident” that they knew the correct answer, a term referred to as overconfidence. These findings are not unique to the moose activity: other studies have shown that 90% CIs typically provide such “hit rates” between only 25% and 40% of the time 4.
Topics for classroom discussion
The in-class activity promotes discussion of data and the uncertainty of population estimates using an example from a charismatic wildlife species. The finding that the distributions of moose population estimates were similar across three different class periods suggests that an activity similar to this approach can be generalized with expected results in the future. Some questions for class discussion may include:
Why are the mean and median so different? In this example, the mean (18,981 moose) and median (3,500 moose) were starkly different. Discussions in the classroom can center around the different measures of central tendency and how they relate to moose population estimates. As an example, the finding that eight students estimated a very high population (greater than 50,000 moose) had a greater influence on the mean value, but not the median.
Which observations are “suspicious” data points? The role of outliers, as seen in the boxplots in Figure 2, can be discussed in the classroom. Discussing how and why outliers exist in a dataset is worth mentioning. If a single data point falls outside the general pattern, how much would you trust it and how would you handle it in an analysis?
Why are we so overconfident? Students have been surprised to learn that a low proportion of them estimated “very close” to the true number of moose, e.g., only 55% of students guessed a 90% confidence interval that contained the true population estimate. At this point it is an ideal time to revisit the confidence interval and discuss a likely component that the student might have missed: the margin of error. Reviewing concepts related to the standard deviation and its role in determining the width of the confidence interval would be valuable.
“I’m 99.9% confident there are between 0 and 1,000,000 moose in Minnesota. Aren’t I right?” This comment from a seemingly wise student may be correct, but not useful in practice. A discussion on the merits of wide versus narrow levels of confidence is worthwhile, and a review of the common levels of confidence in a field of study is worth exploring by the student.
How do agencies estimate wildlife populations? This activity relies heavily on a known moose population calculated by the Minnesota DNR. A broad overview and a subsequent discussion can focus on the sampling methods that agencies use to determine wildlife populations.
Final Thoughts
Using existing datasets collected by others may be convenient, but this approach compels students to be passive learners and students do not experience the issues that arise in data collection and analysis 5. Students were more connected to the moose population dataset because it was generated by themselves. Using data gathered by students promotes an active learning environment in the classroom and encourages students to develop an evidence-based mindset 6.
Coupled with showing visualizations of student responses, the process outlined here provides a structure to bring together student-generated data with concepts of statistics and overconfidence. The example of moose in Minnesota is one example that connected with students, but any example with a well-known species can be used for this lesson. These activities foster data literacy in undergraduate students, a competence that is needed to solve real-world problems in an increasingly data-driven world.
Acknowledgments
Special thanks to the students in the Unversity of Minnesota’s NR5021 (Fall 2017 and Fall 2018) and ESPM3012 classes (Spring 2018) for their participation in this activity.
References
By Matt Russell. Leave a comment below or email Matt with any questions or comments.
A. Gelman and D. Nolan. 2014. Teaching statistics: a bag of tricks, 2nd Ed. Oxford University Press, Oxford, UK.↩
GAISE College Report ASA Revision Committee. Guidelines for assessment and instruction in statistics education, college report 2016.↩
L. Taylor and K. Doehler. 2014. Using online surveys to promote and assess learning. Teaching Statistics 36, 34-40.↩
K. H. Teigen, and M. Jøgensen. 2005. When 90% confidence intervals are 50% certain: on the credibility of credible intervals. Appl. Cogn. Psychol. 19, 455-475.↩
M. M. Marron and A.S. Wahed. 2016. Teaching missing data methodology to undergraduates using a group-based project within a six-week summer program. J. Stat. Educ. 24, 8-15.↩
D. Schuff. 2018. Data science for all: a university-wide course in data literacy. In: A. V. Deokar, A. Gupta, L. S. Iyer and M. C. Jones, editors, Analytics and Data Science: Advances in Research and Pedagogy. Springer International Publishing. p. 281-297.↩