The statistics community has had a lot of discussion in recent years about the role of p-values and statistical significance. This has led some to question if we’re relying too much on them as a way of interpreting results from a statistical analysis.
The “p” in p-value stands for probability, or the probability under a statistical model that a summary of the data would be equal to or more extreme than its observed value. There are few caveats with using p-values and interpreting them.
First, assessing statistical significance is commonly done using the p-value as a threshold. As the American Statistical Association highlighted in 2016 “statistical significance is not equivalent to scientific, human, or economic significance”.
Second, a p-value can be small if the number of samples or measurement precision is high enough. Similarly, a p-value can be large if the sample size is small or measurements are imprecise.
Lastly, a p-value doesn’t measure the size of an effect or the importance of a result. So a p-value of 0.0001 does not indicate a more important result than a p-value of 0.045. This is where I’ve heard many a graduate student say “My p-value is so small, my results are VERY significant!”
Much of the data science community is moving away from using p-values. The scrutiny over the interpretation and use of p-values has also reached academic publishing. Some journals have outlawed the use of p-values in their journals. Some editors are providing specific instructions for authors on how to report (and not report) p-values in their journals.
P-values in the Journal of Forestry
So should foresters stop relying on using p-values? Probably not. (After all, I don’t want to be labeled a hypocrite because I use them a lot.) Out of curiosity, I was interested to see how often p-values are used in forestry research.
I set up a small experiment: to look at how many p-values were reported in the Journal of Forestry in 2021 (find the data here).
What counted as a p-value was more complicated than I first thought. Oftentimes authors will mention the true p-value from a statistical test either in the text or most commonly, in a table of results. However, other times, no doubt a result of the software being used, authors will report the asterisk or double asterisk that shows the significance at a specific level. For example, * and ** were written to denote significance at the 0.10 and 0.05 levels, respectively. Other times p-values will be embedded within figures, which makes finding them with a text string search problematic.
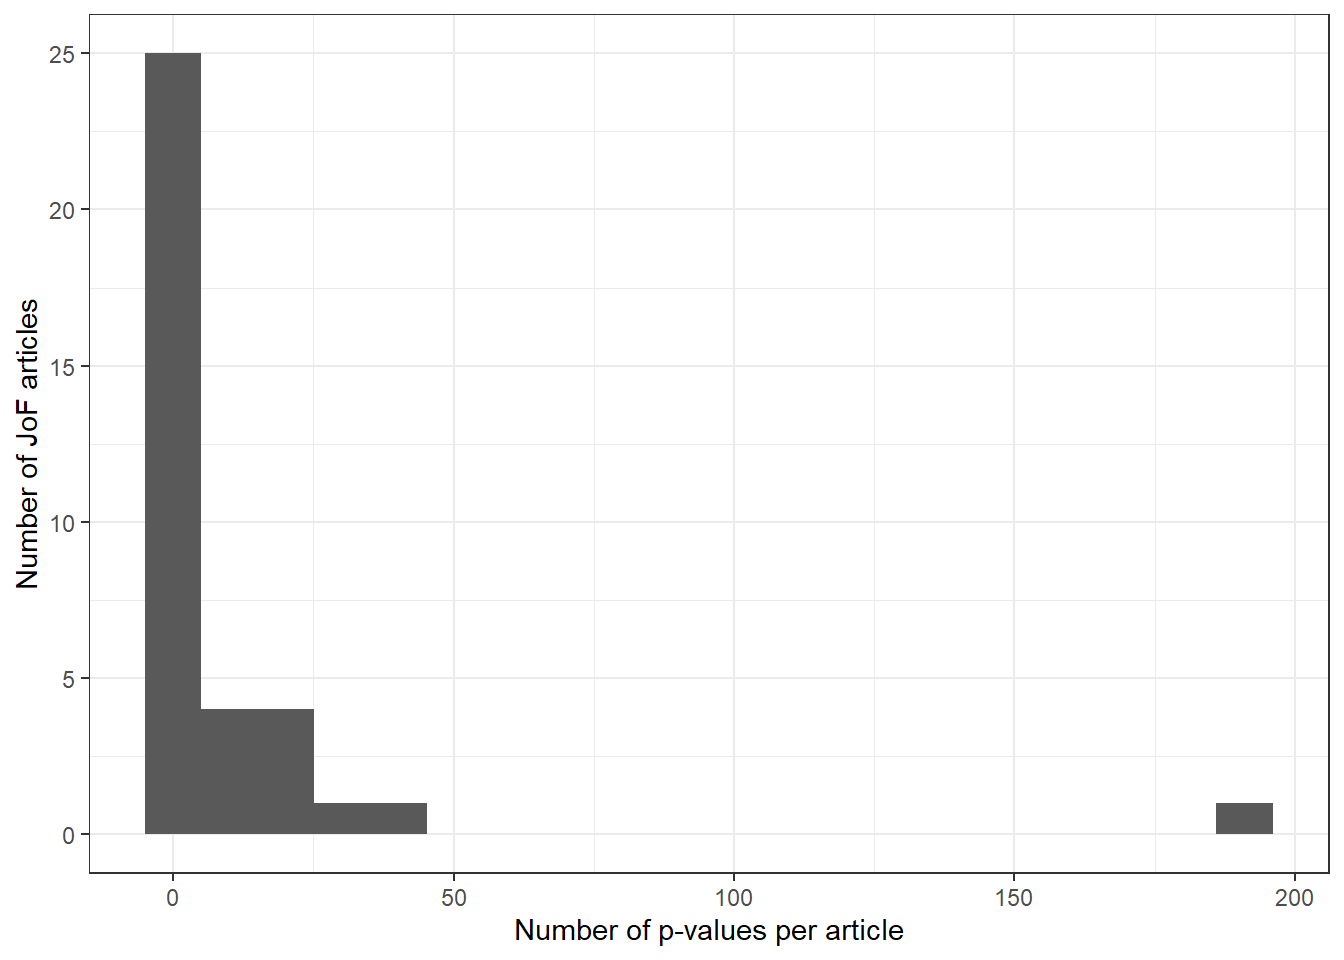
Despite the challenges, out of the 36 research and review articles published in the Journal of Forestry in 2021, 61% did not present any p-values. Here is the distribution of p-values from the articles:
Of those that did present p-values, the median number of p-values per article was 15. There was one paper that presented 191 different p-values (which made excellent use of the asterisk approach).
I have no idea if the use of p-values in forestry has increased or decreased since they began to be used widely in the mid 1900’s. It strikes me that as we continue to teach hypothesis testing to students, p-values will continue to be used in the future.
While there are many caveats, I really like the ASA’s shortcut to “remember ATOM” when using p-values. When thinking about them, remember to:
- Accept uncertainty. Data are noisy in the real world. By accepting the uncertainty inherent in the data, we move away from categorizing variables and attributes as either “significant” or “not significant”.
- Be thoughtful. Practicing thoughtful data analysis allows analysts to assess their workflow and applications of their work. Are you engaging in exploratory data analysis on a project? Or are your results going to inform key decisions and a thorough statistical analysis is needed?
- Be open. Being open about your analysis stresses the importance of recognizing that subjectivity is present in any statistical analysis. This is also true when considering the role of expert judgment in the data analysis project and the interpretation of a project’s findings. When communicating p-values, a practical tip is to present them as continuous values rather than dichotomized ones (e.g., report p = 0.04234 not p < 0.05). The “asterisks” that are provided by statistical software don’t help with this one.
- Be modest. Being modest encourages you to think about how others might be able to reproduce your work. More broadly, being modest promotes the limitations of statistical knowledge in the larger discipline of scientific understanding.
It’s important to reflect on the role of hypothesis tests and p-values are and what they aren’t. Forest biometricians and analysts should have these in their toolbox, but also be aware of their proper use.
–
By Matt Russell. Sign up for my monthly newsletter for in-depth analysis on data and analytics in the forest products industry.