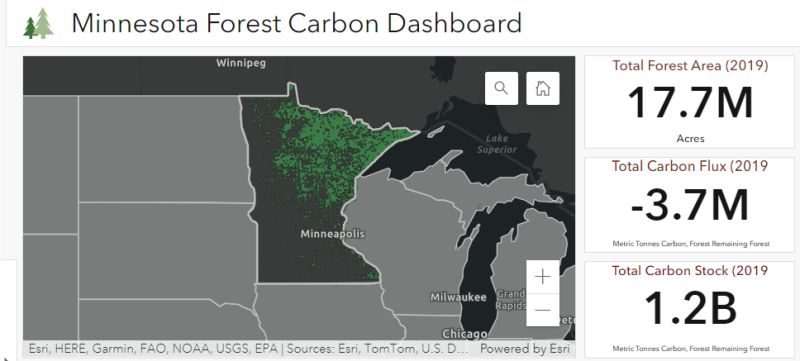
Long-term trends in carbon flux from US forests show a declining sink strebgth. It relates to forest management.
A change to the SDIMax keyword can improve predictions of long-term forest growth.
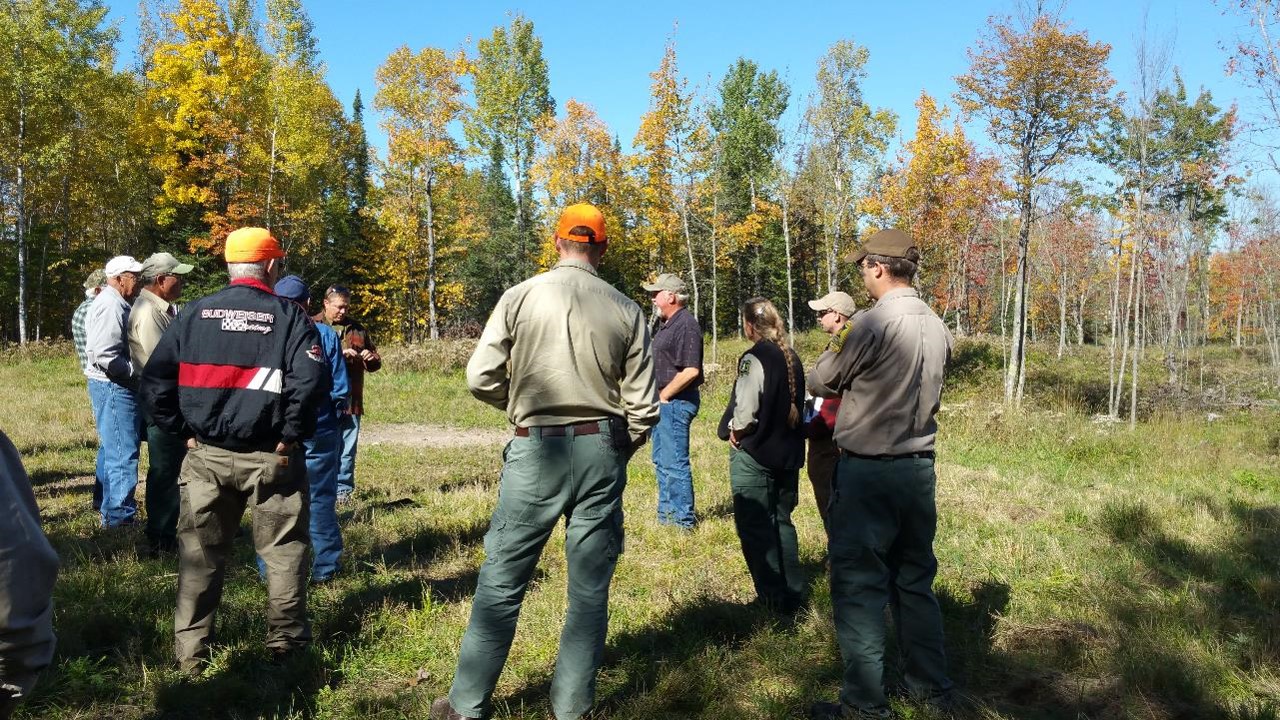
A reminder to know your audience when asking for data.
A useful tool to determine carbon impacts in afforestation and reforestation projects.
The value of decades worth of forestry research is irreplacable.
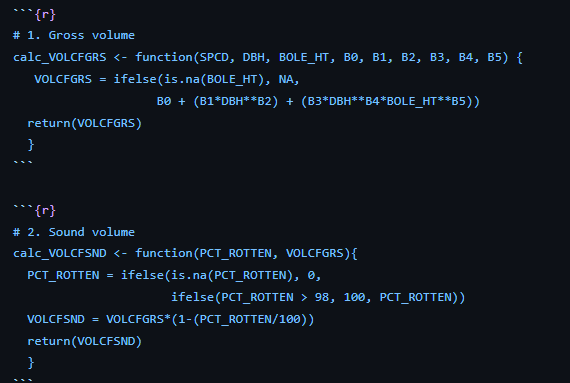
How sensitive are the components of a forest carbon project’s baseline equation?
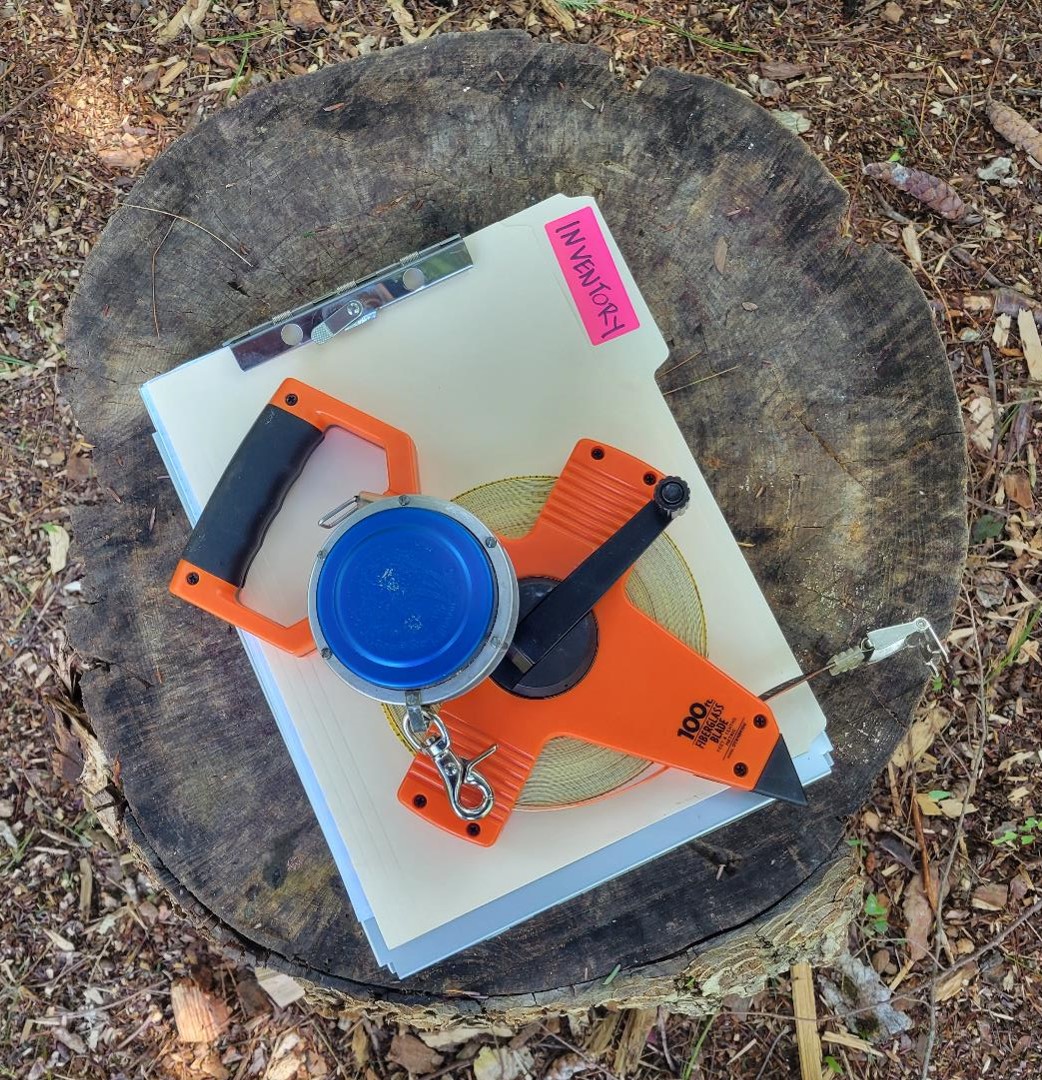
Workshop will provide an overview and practical approaches for accessing FIA data.
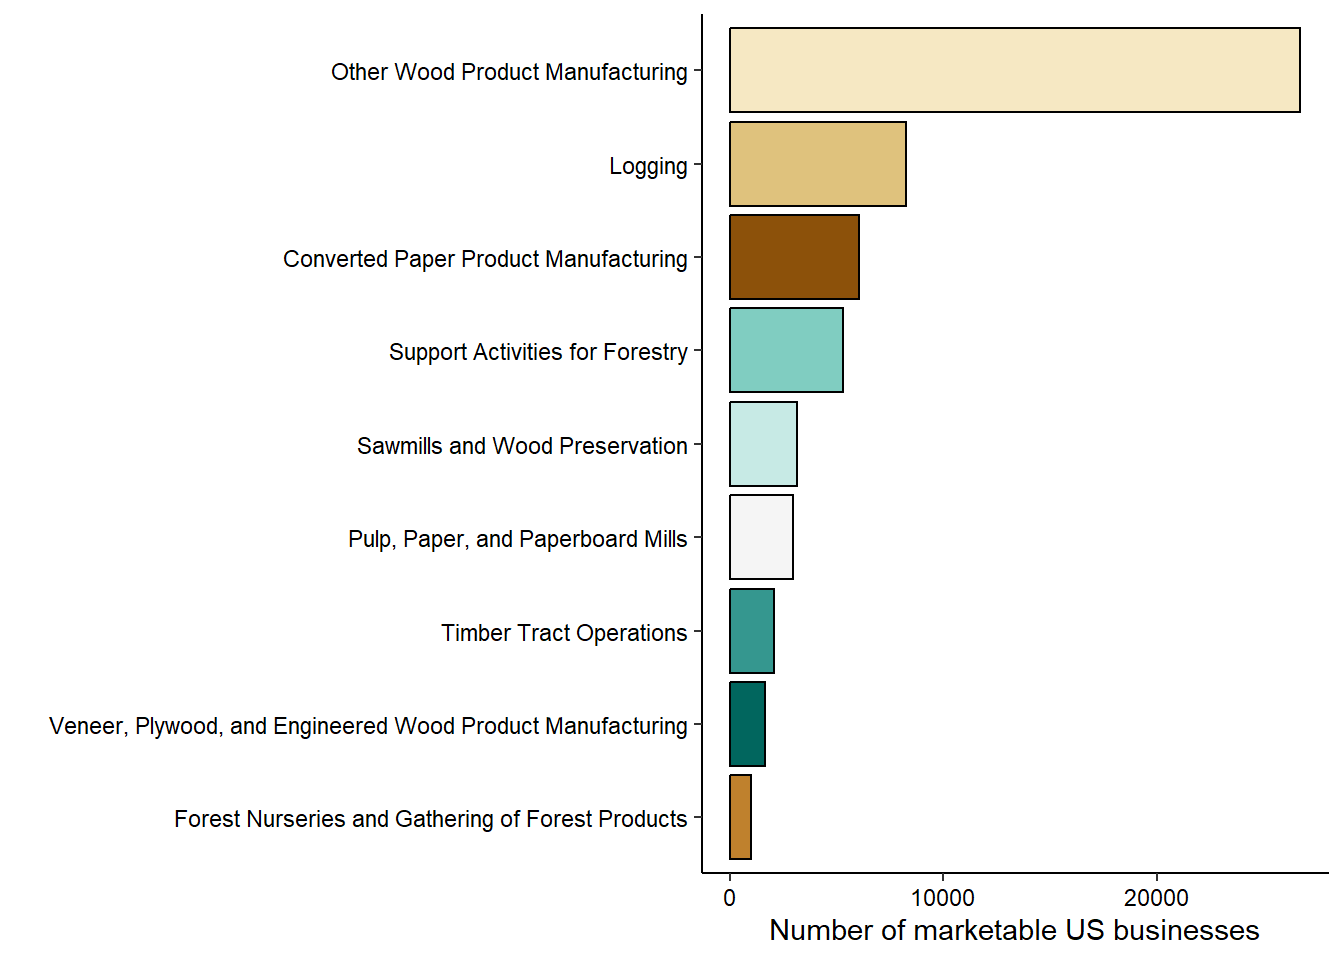
Understanding different roles that support forestry analytics.
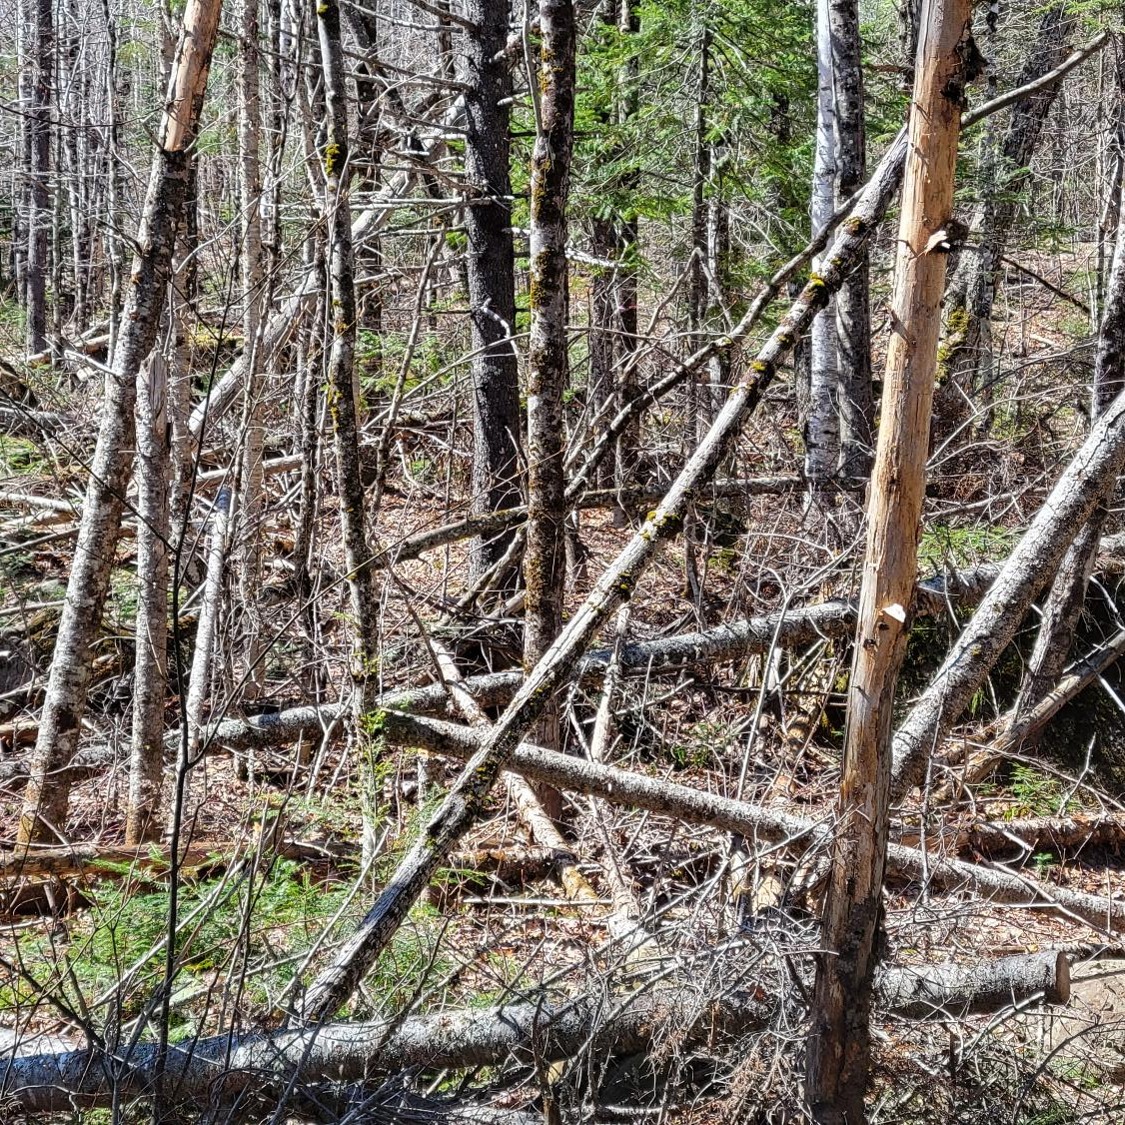
Looking at dead wood carbon pools across US forests.
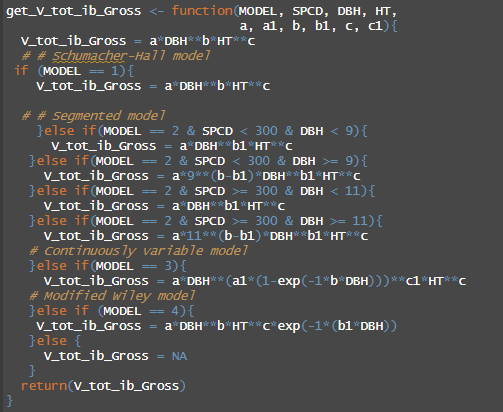
Comparing multiple equations that predict forest carbon in the Forest Vegetation Simulator.
Highlighting the year’s most accessed blog posts.
Data and measurements on the 2025 Rockefeller Center Christmas Tree.
Using forest inventory data, USDA Forest Service provides methods for quantifying old growth forests.
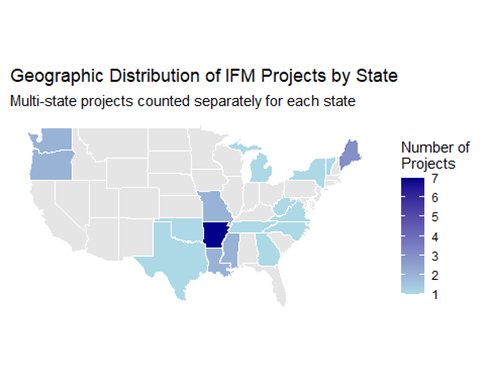
To date, 21 Improved Forest Management (IFM) projects have been submitted to ACR under the new 2.1 methodology.
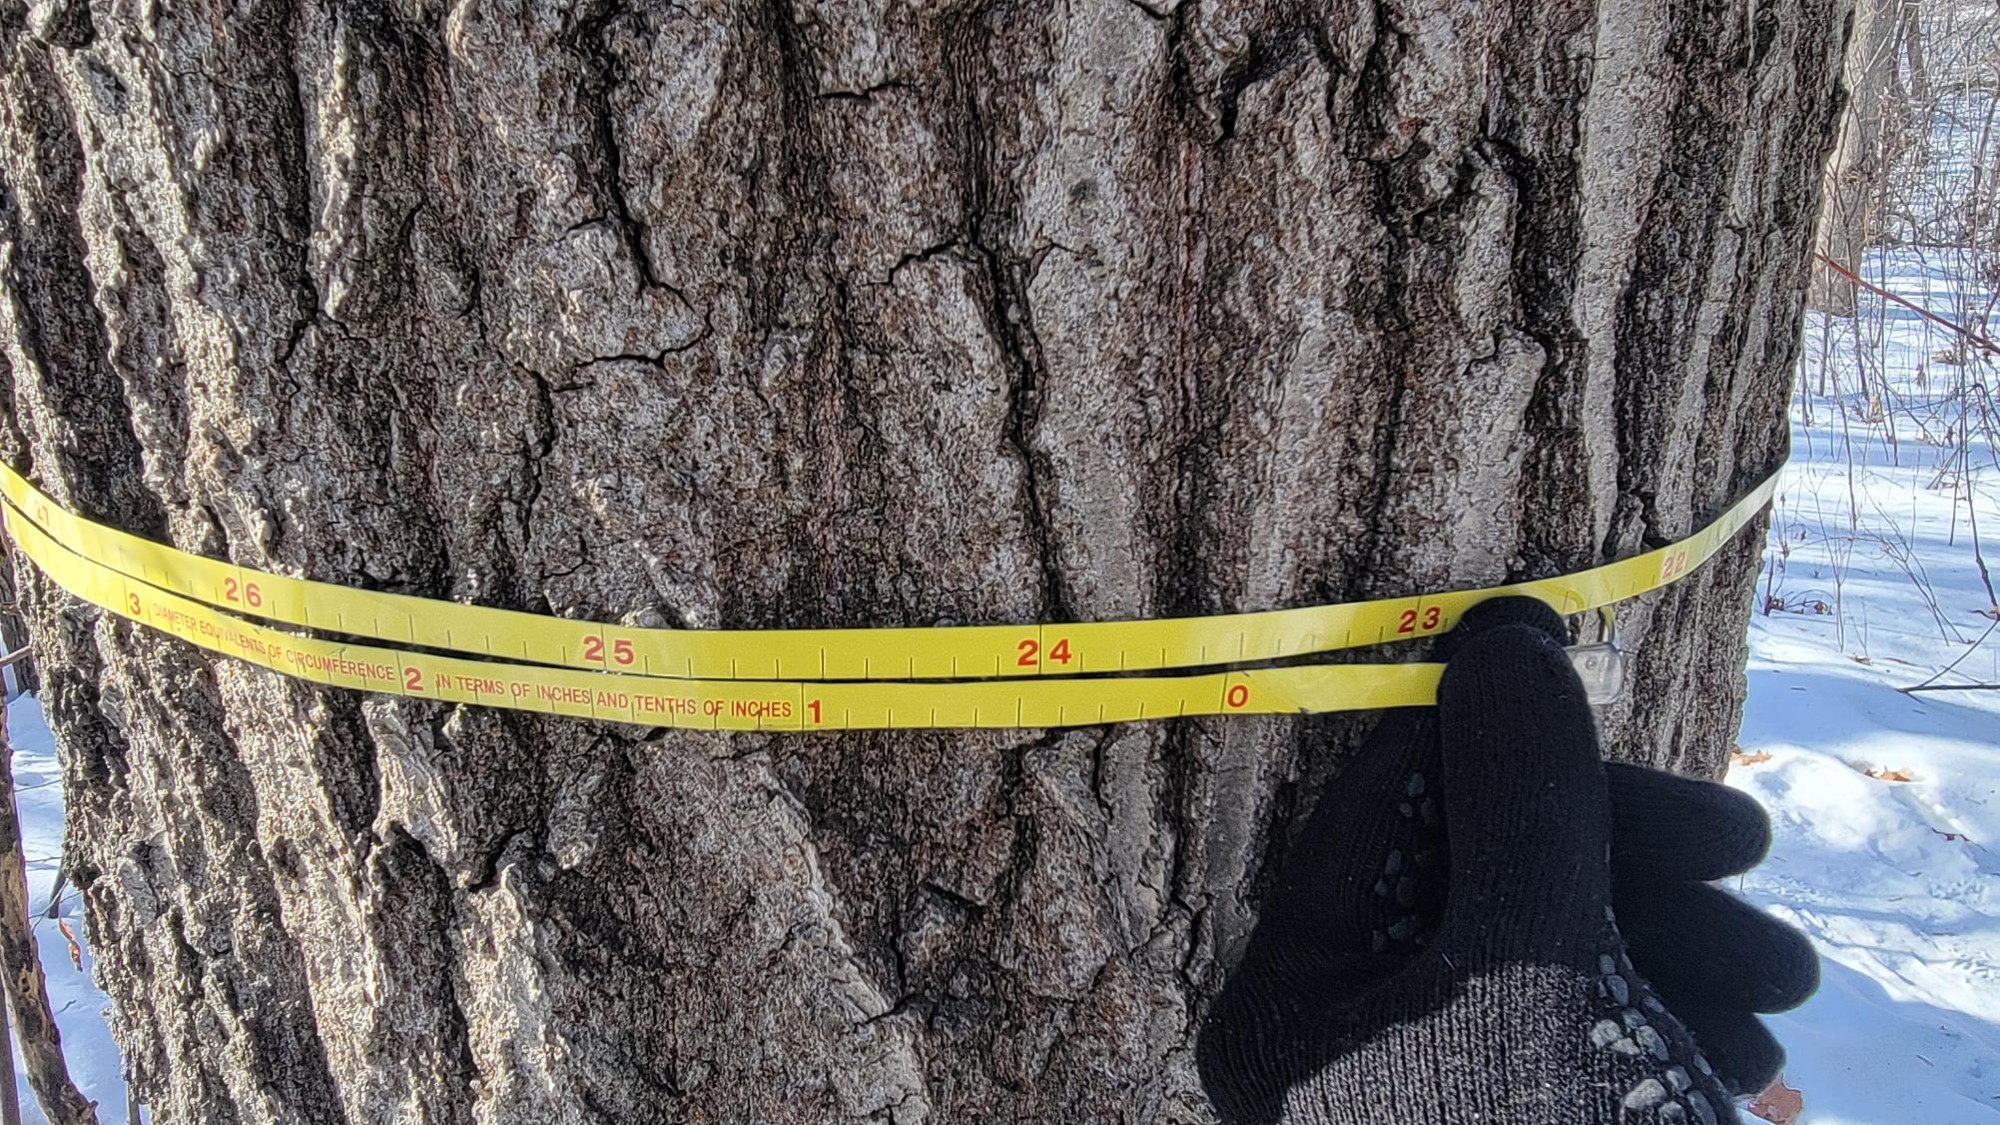
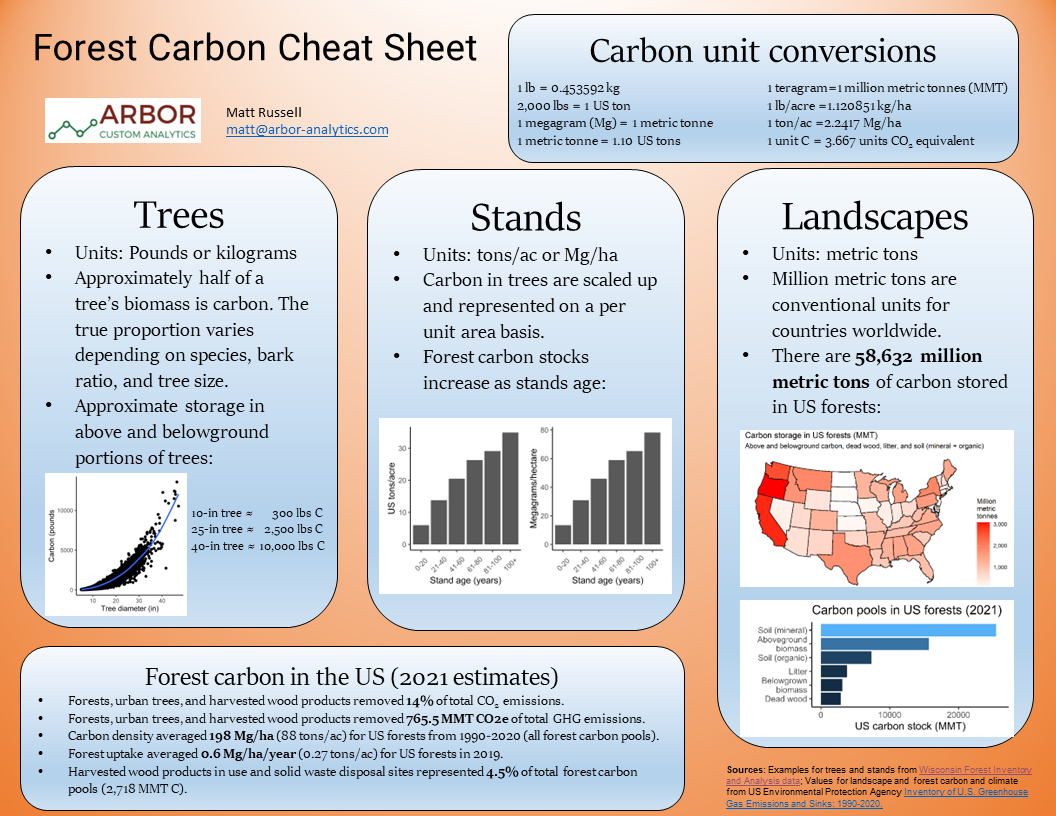
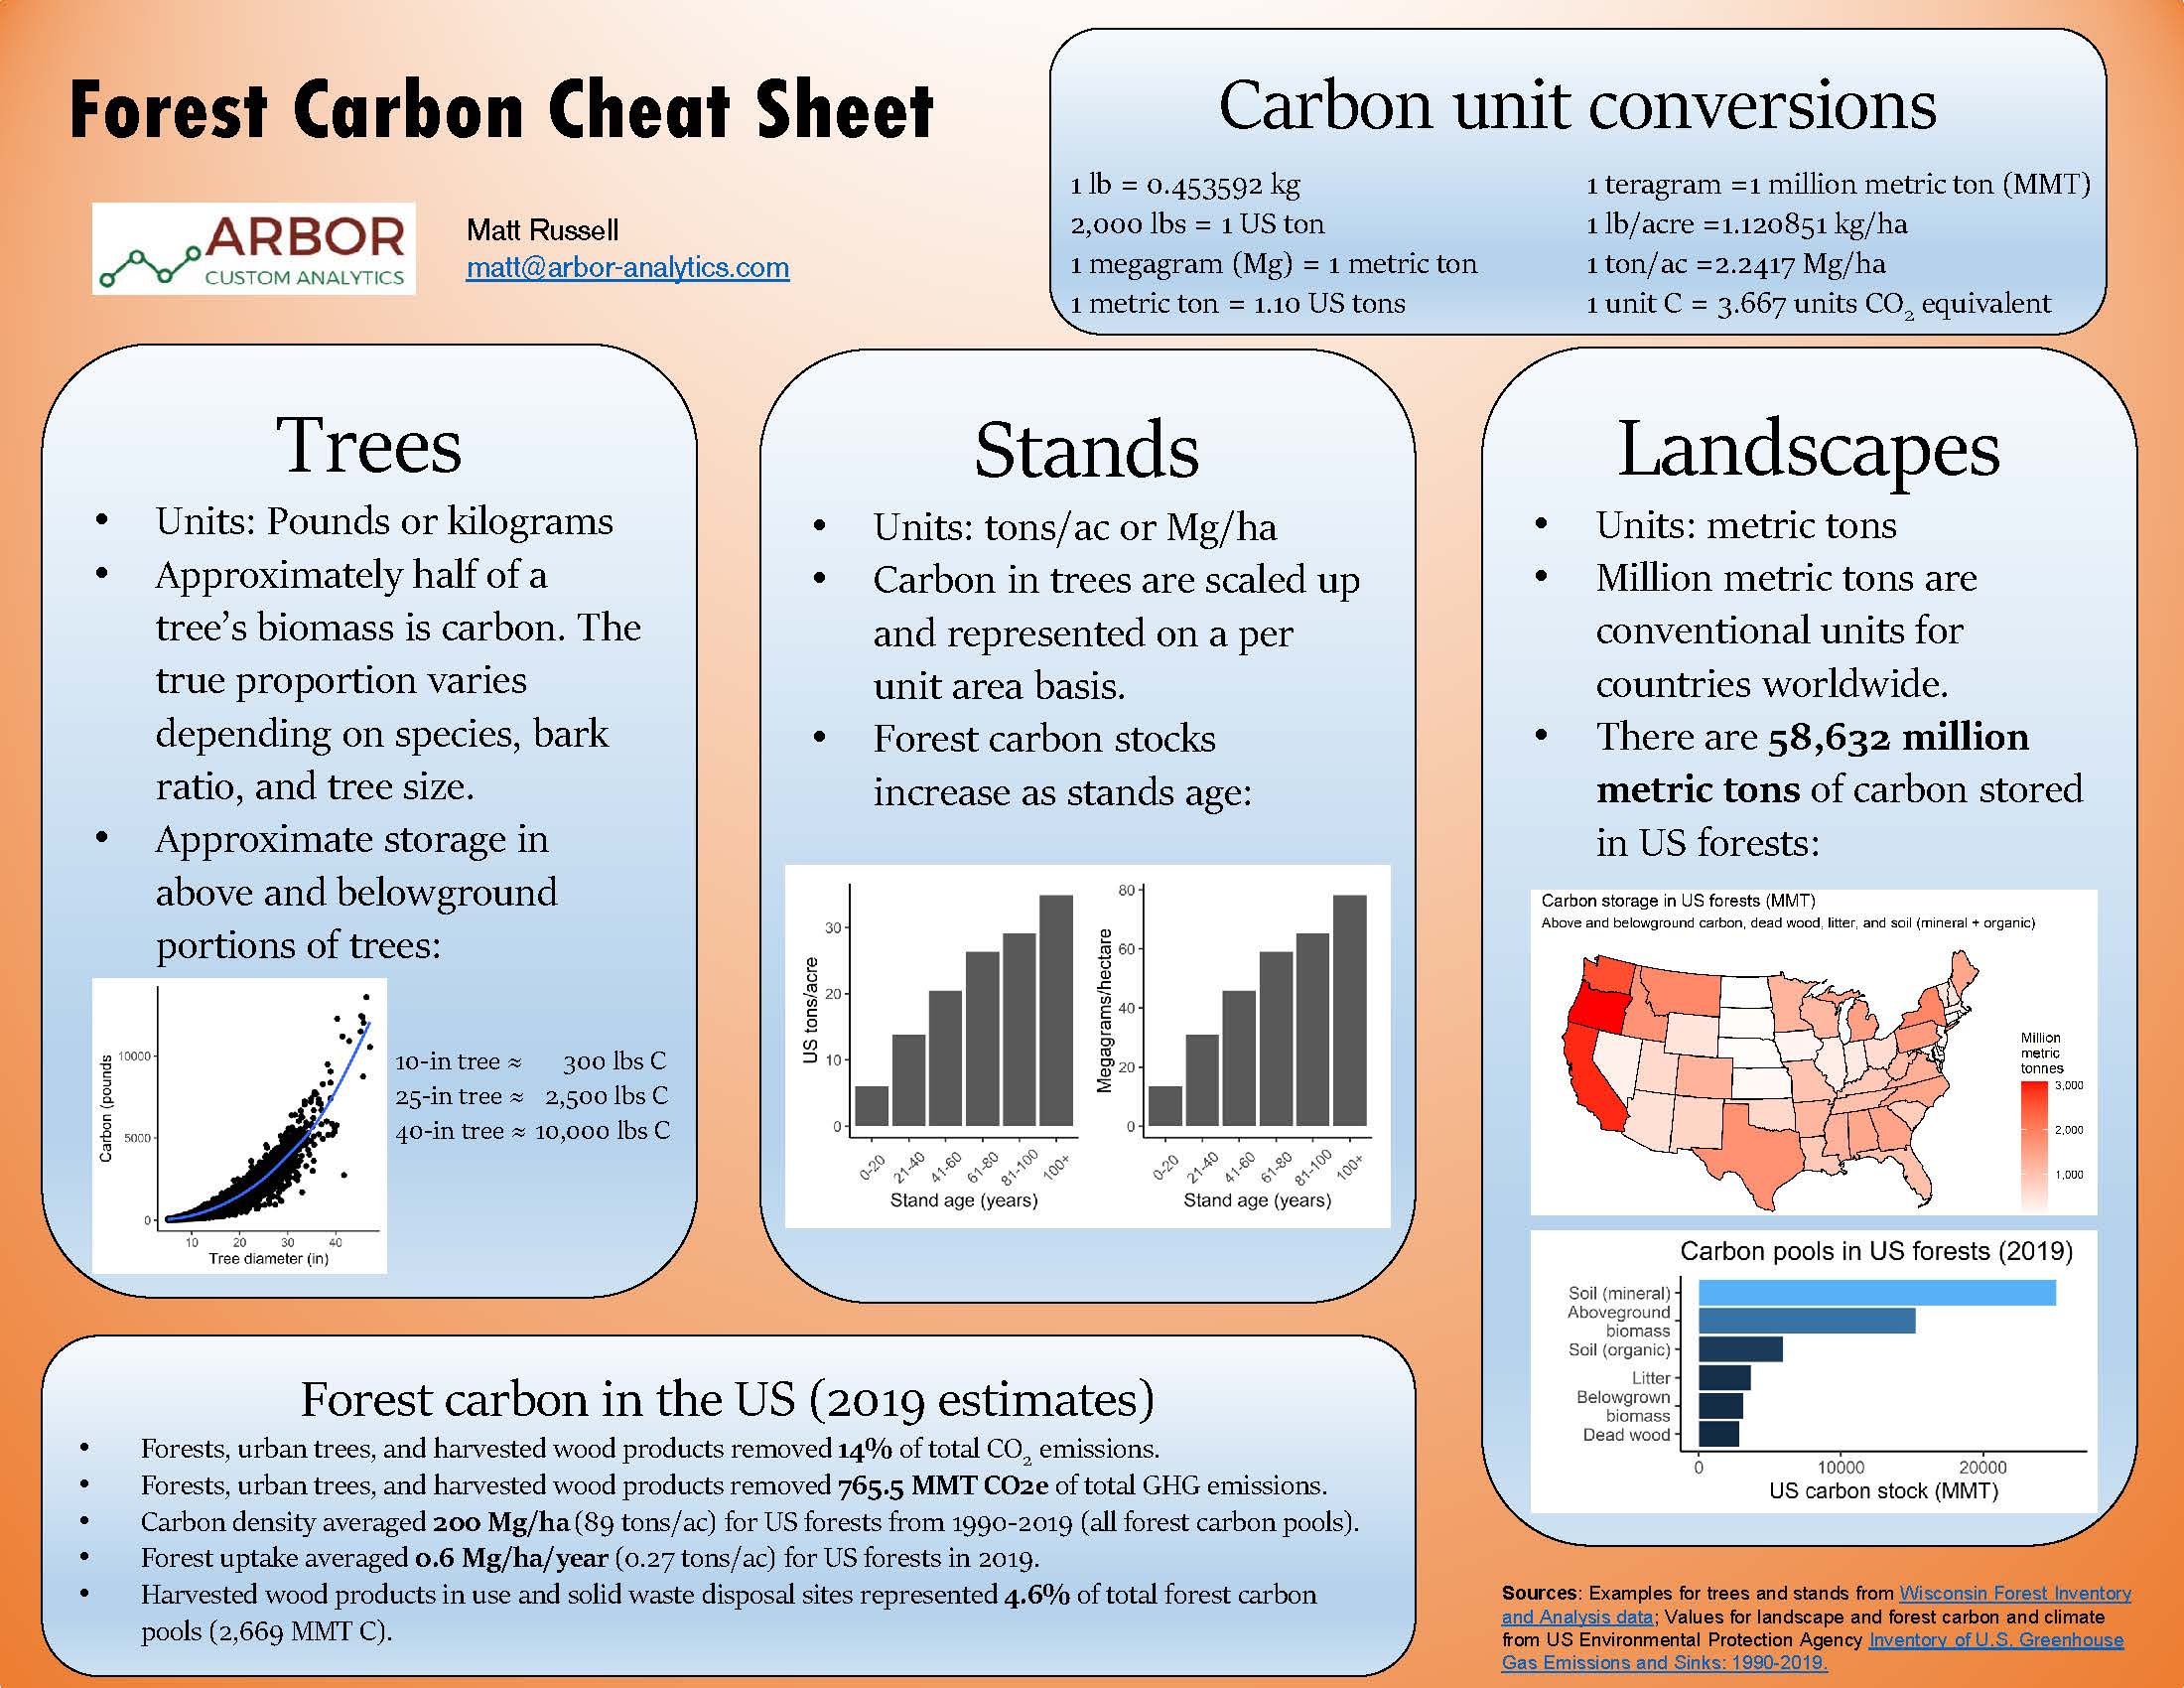
Converting between units used in carbon markets and timber markets can improve your forest data literacy.
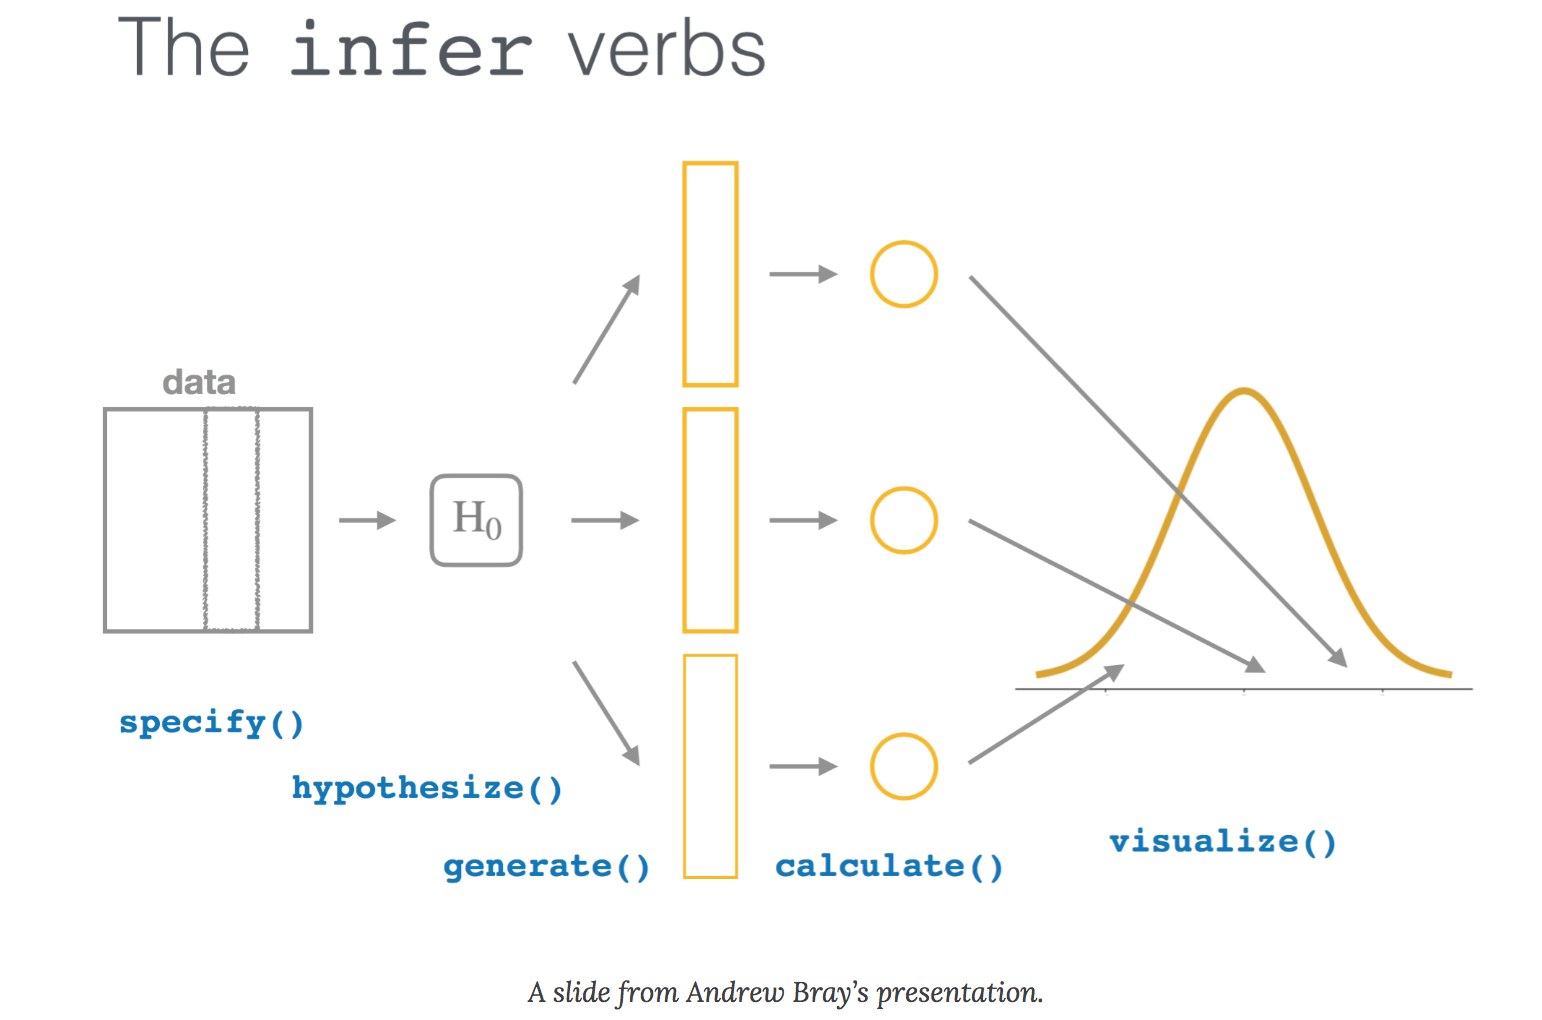
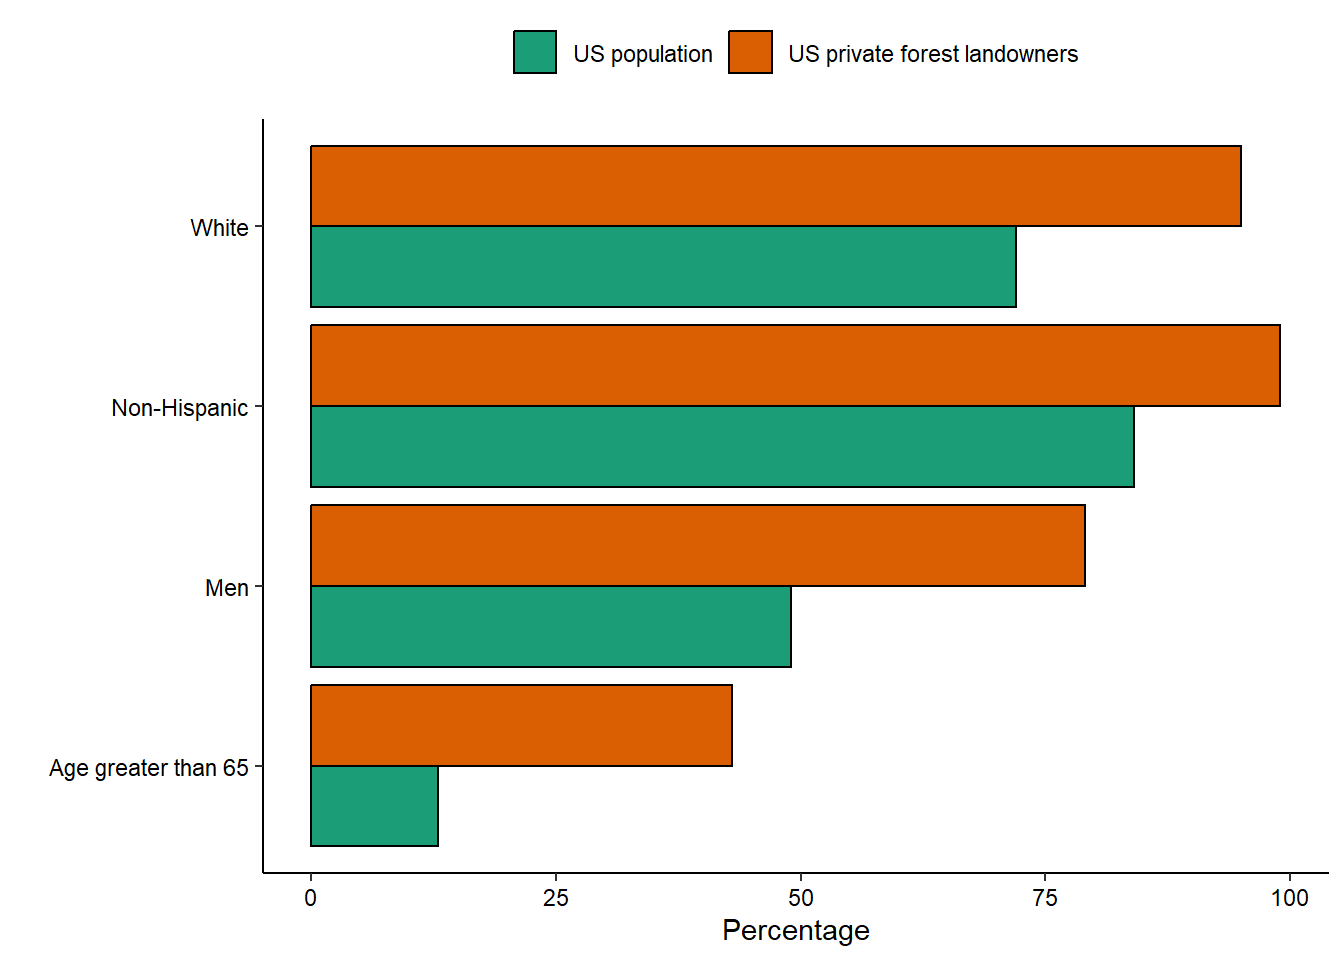
How you show communicate data is just as important as the data itself.
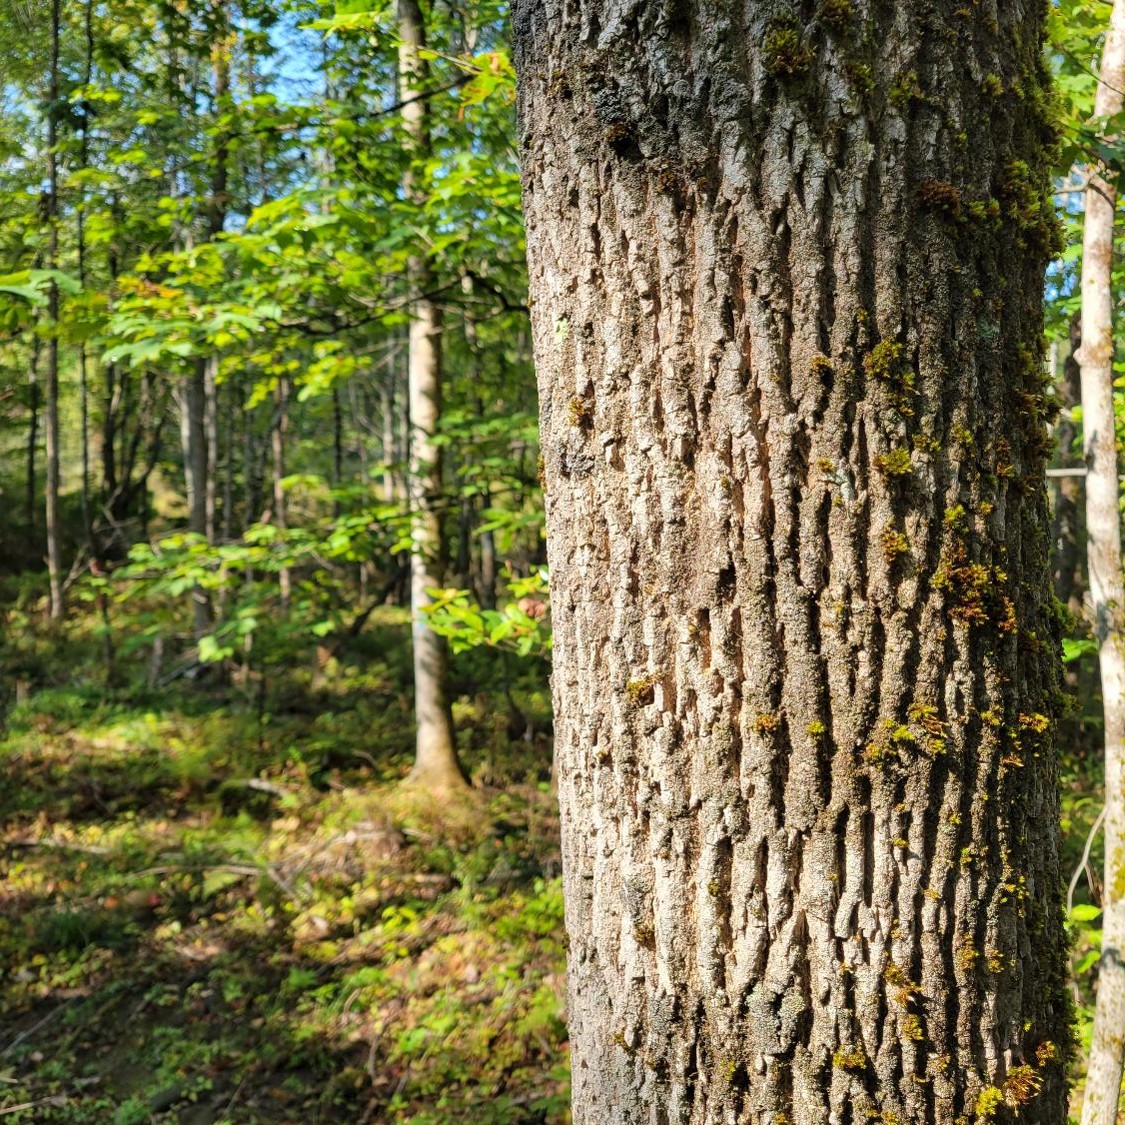
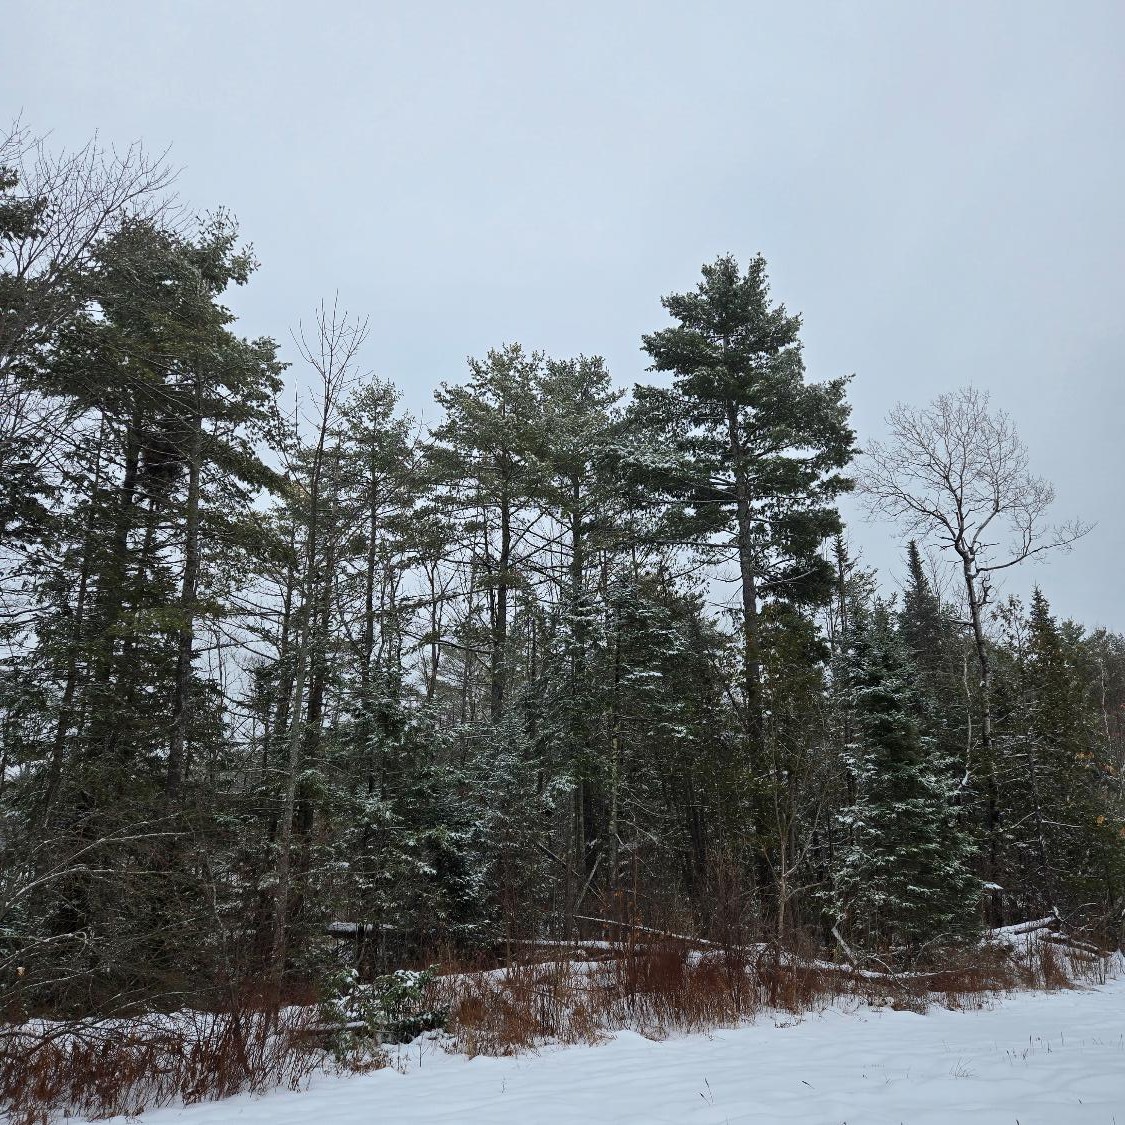
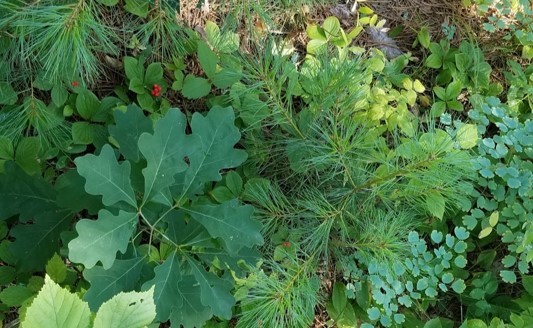
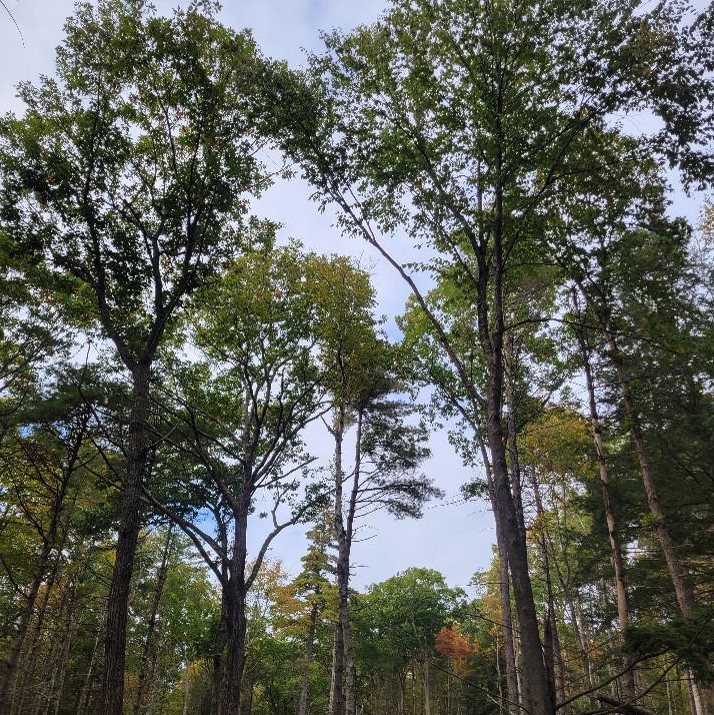
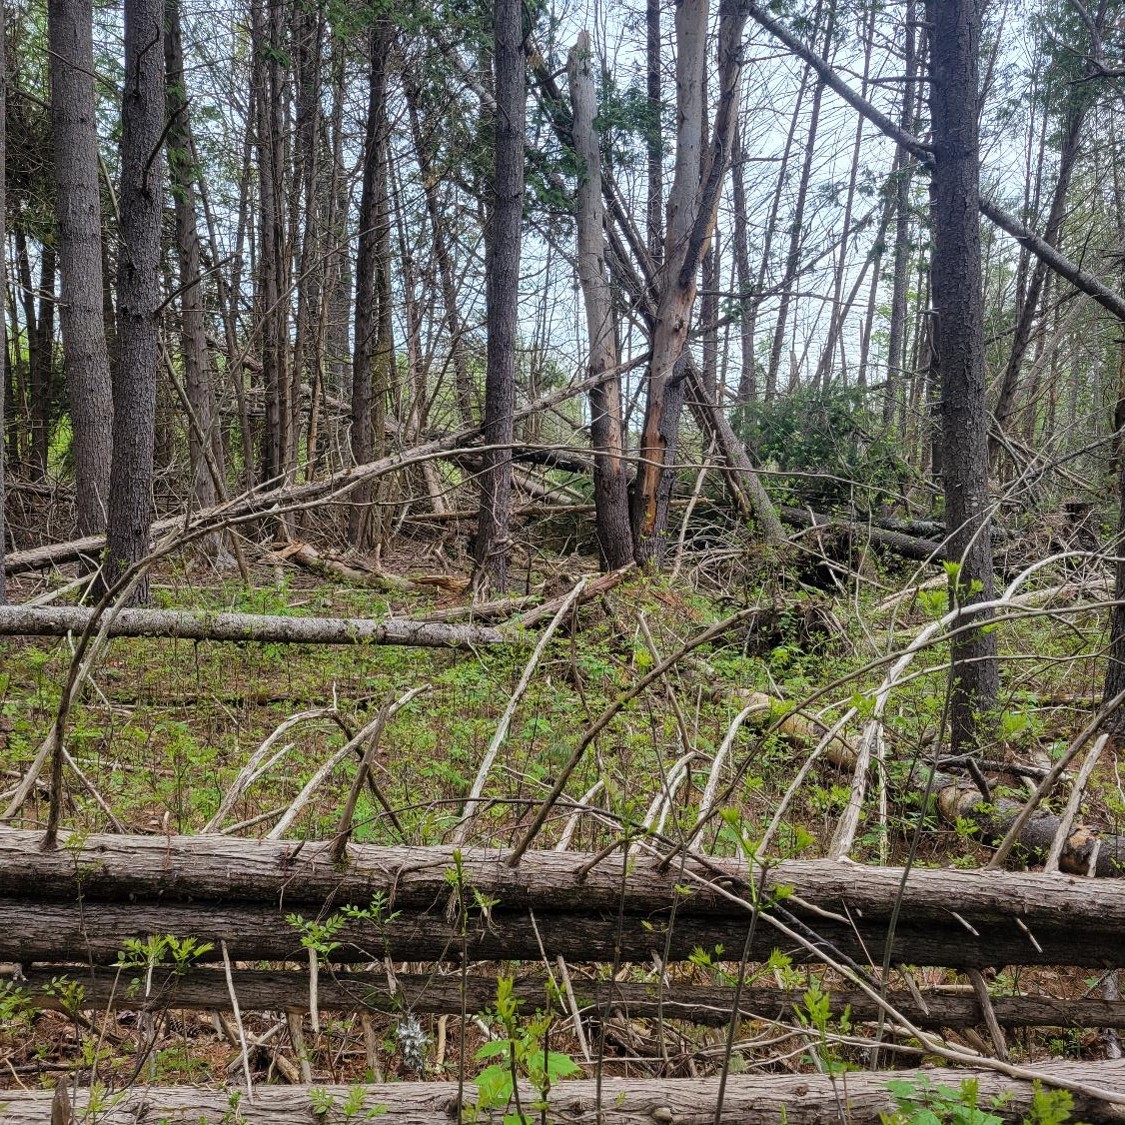
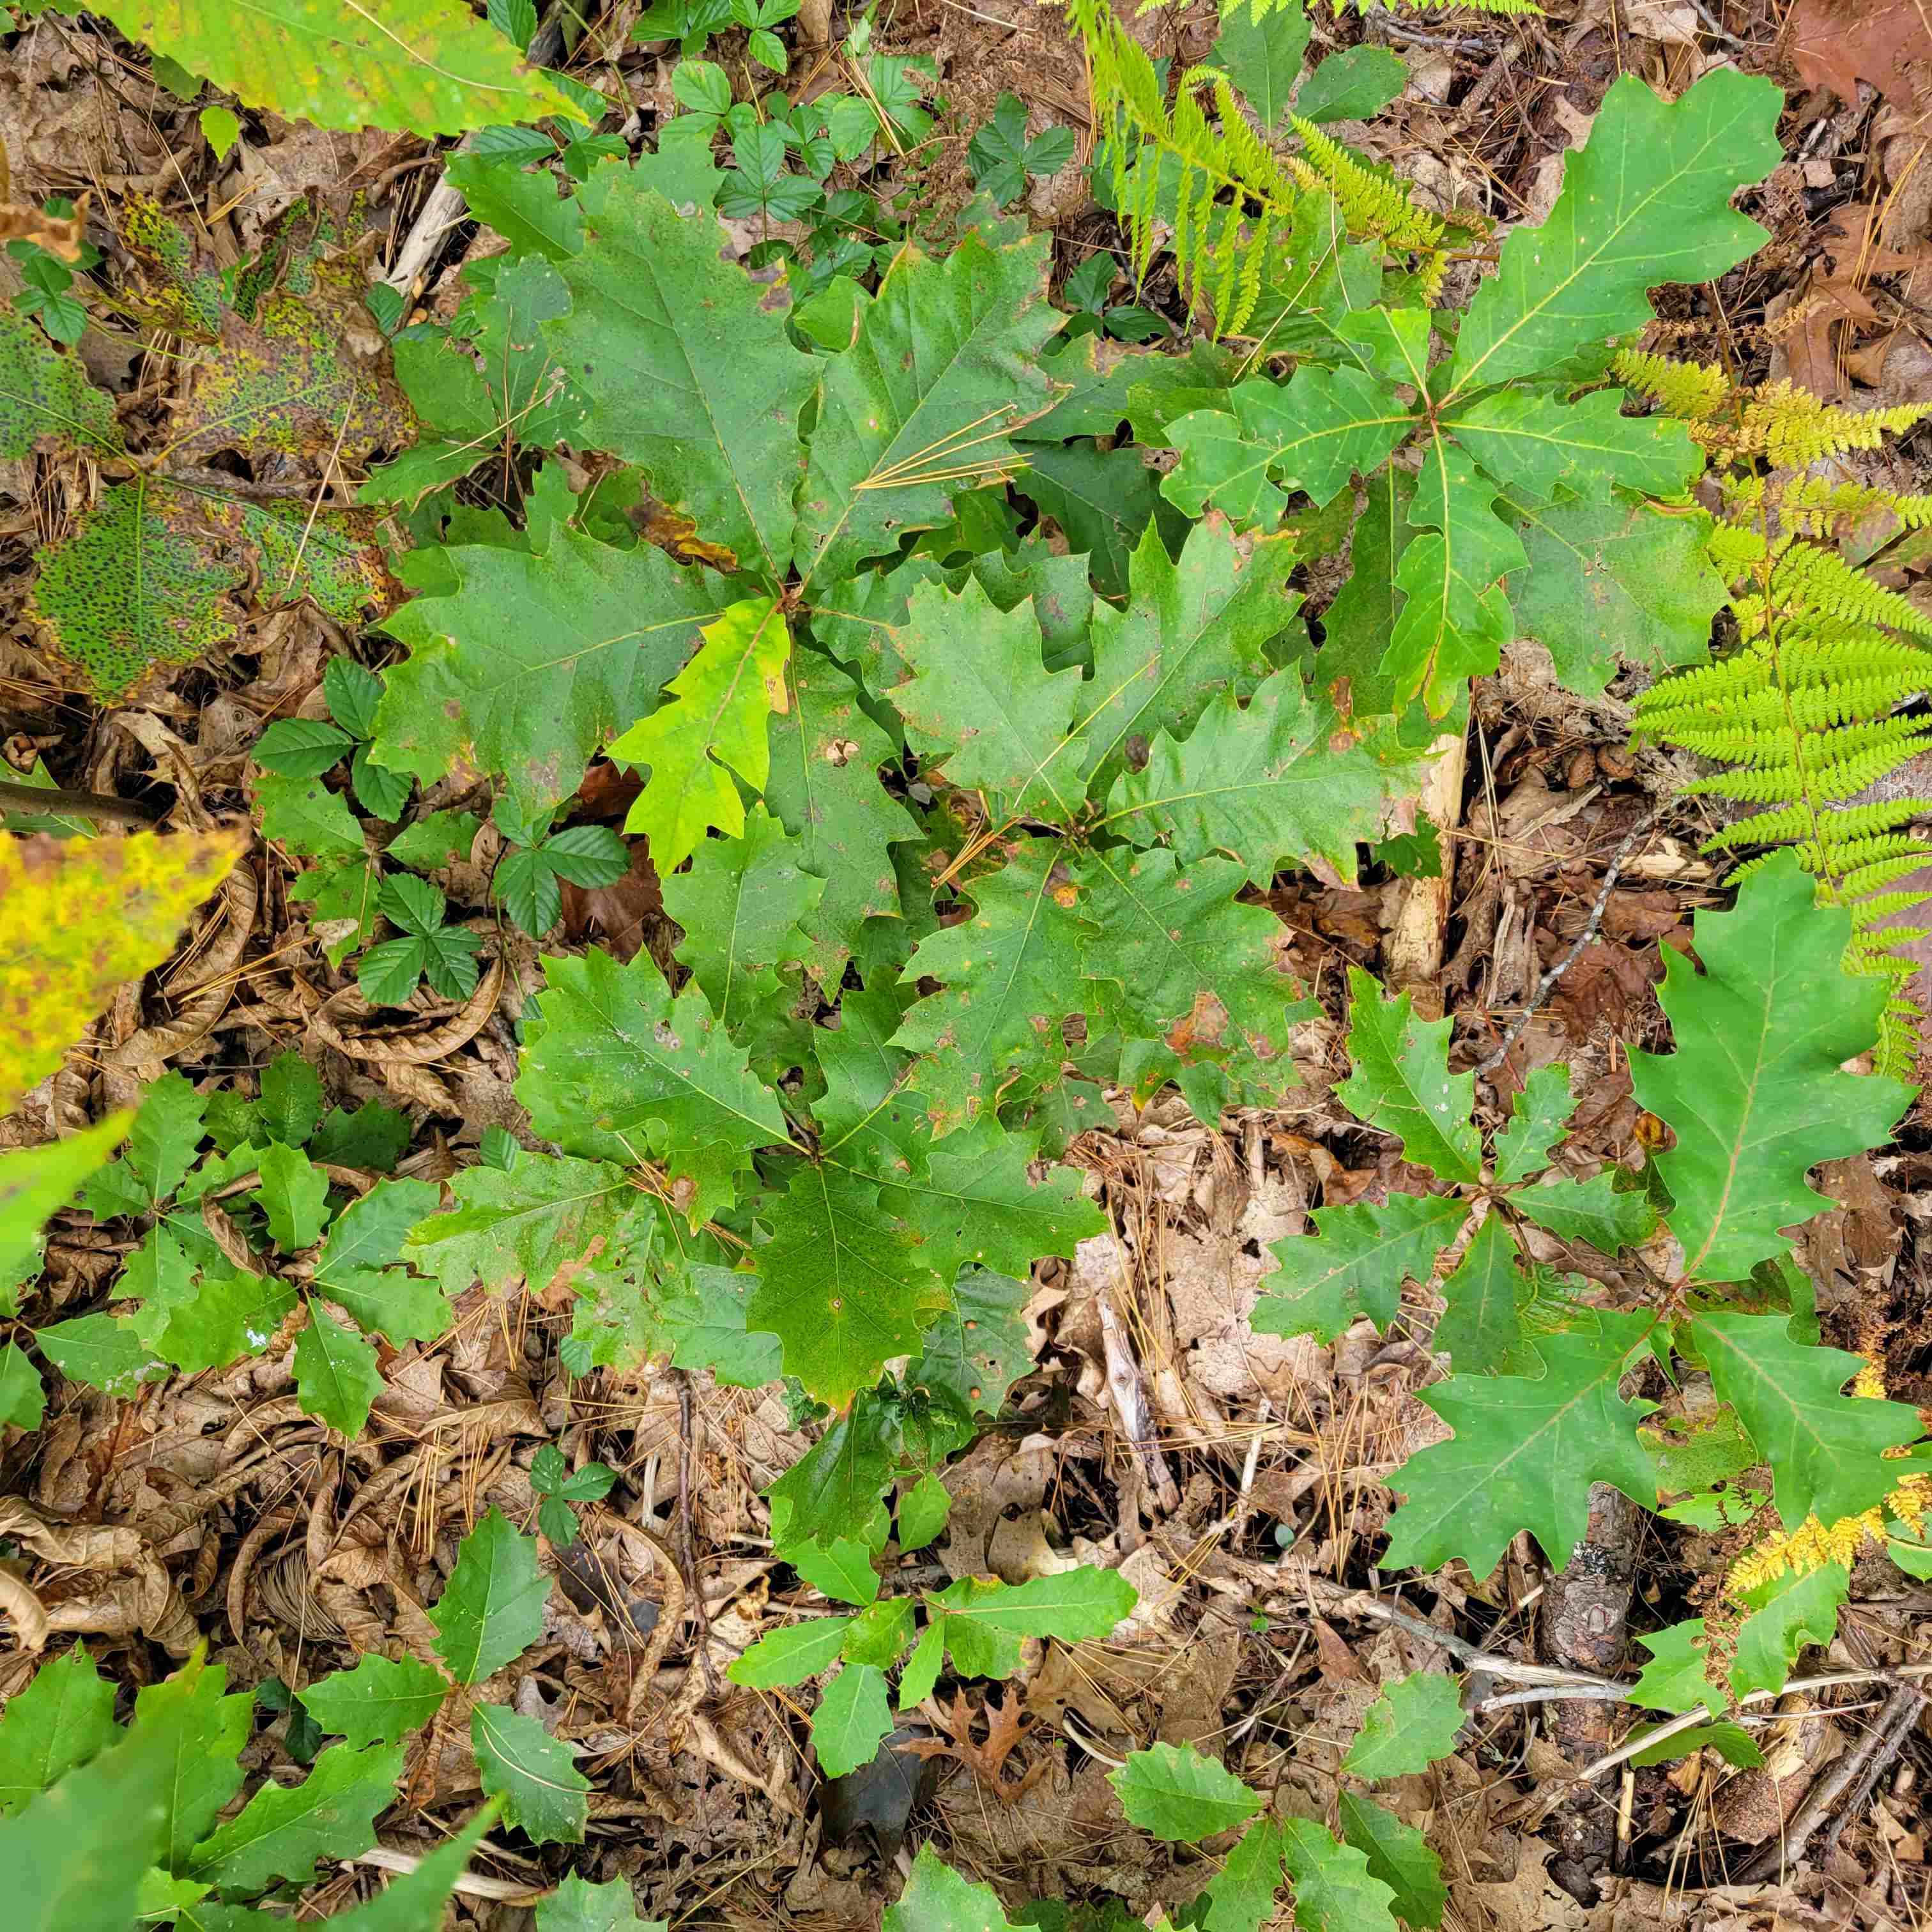
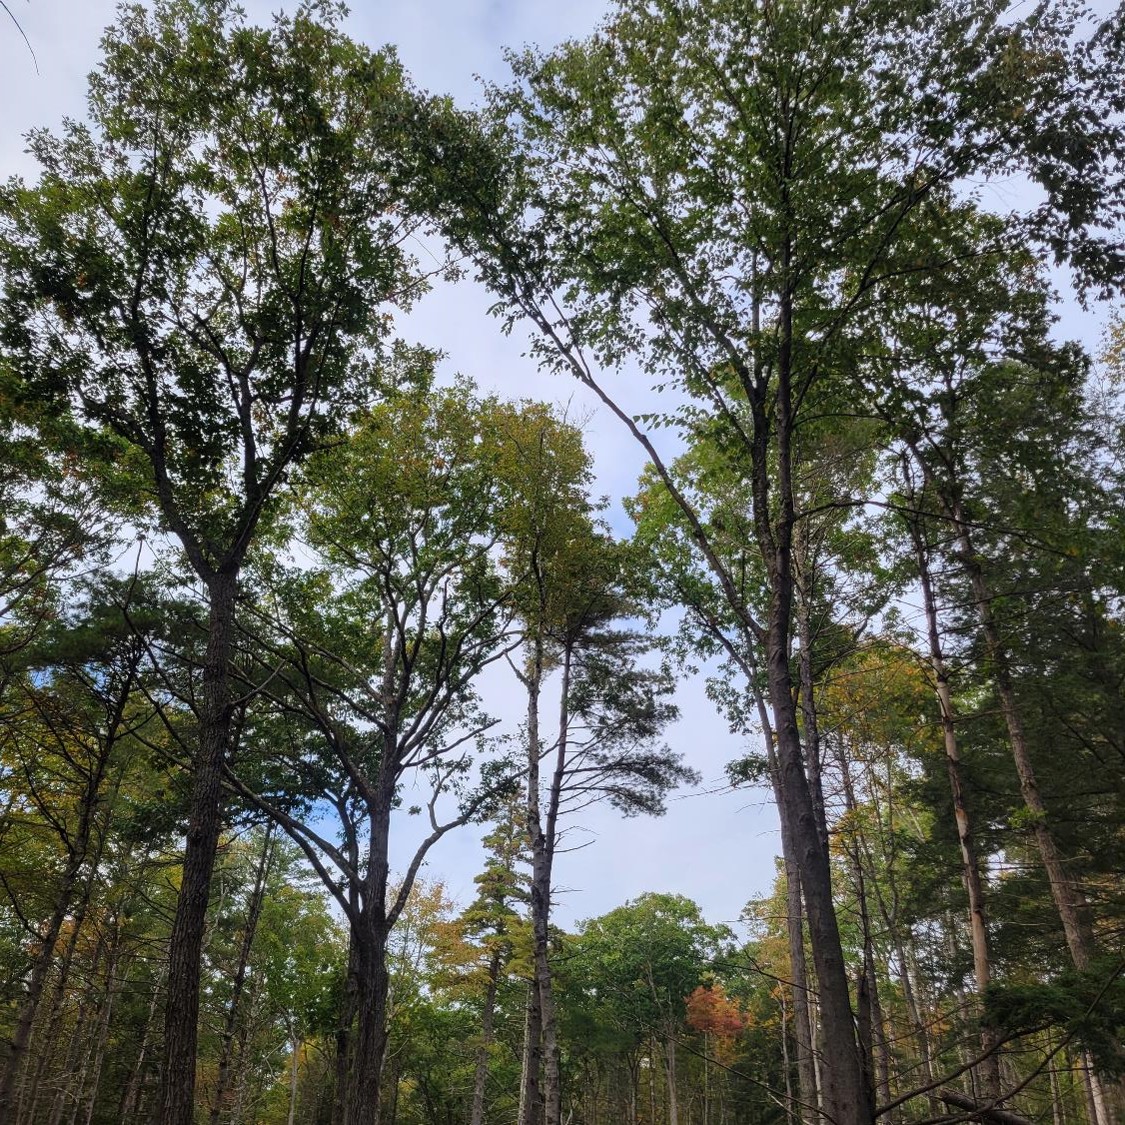
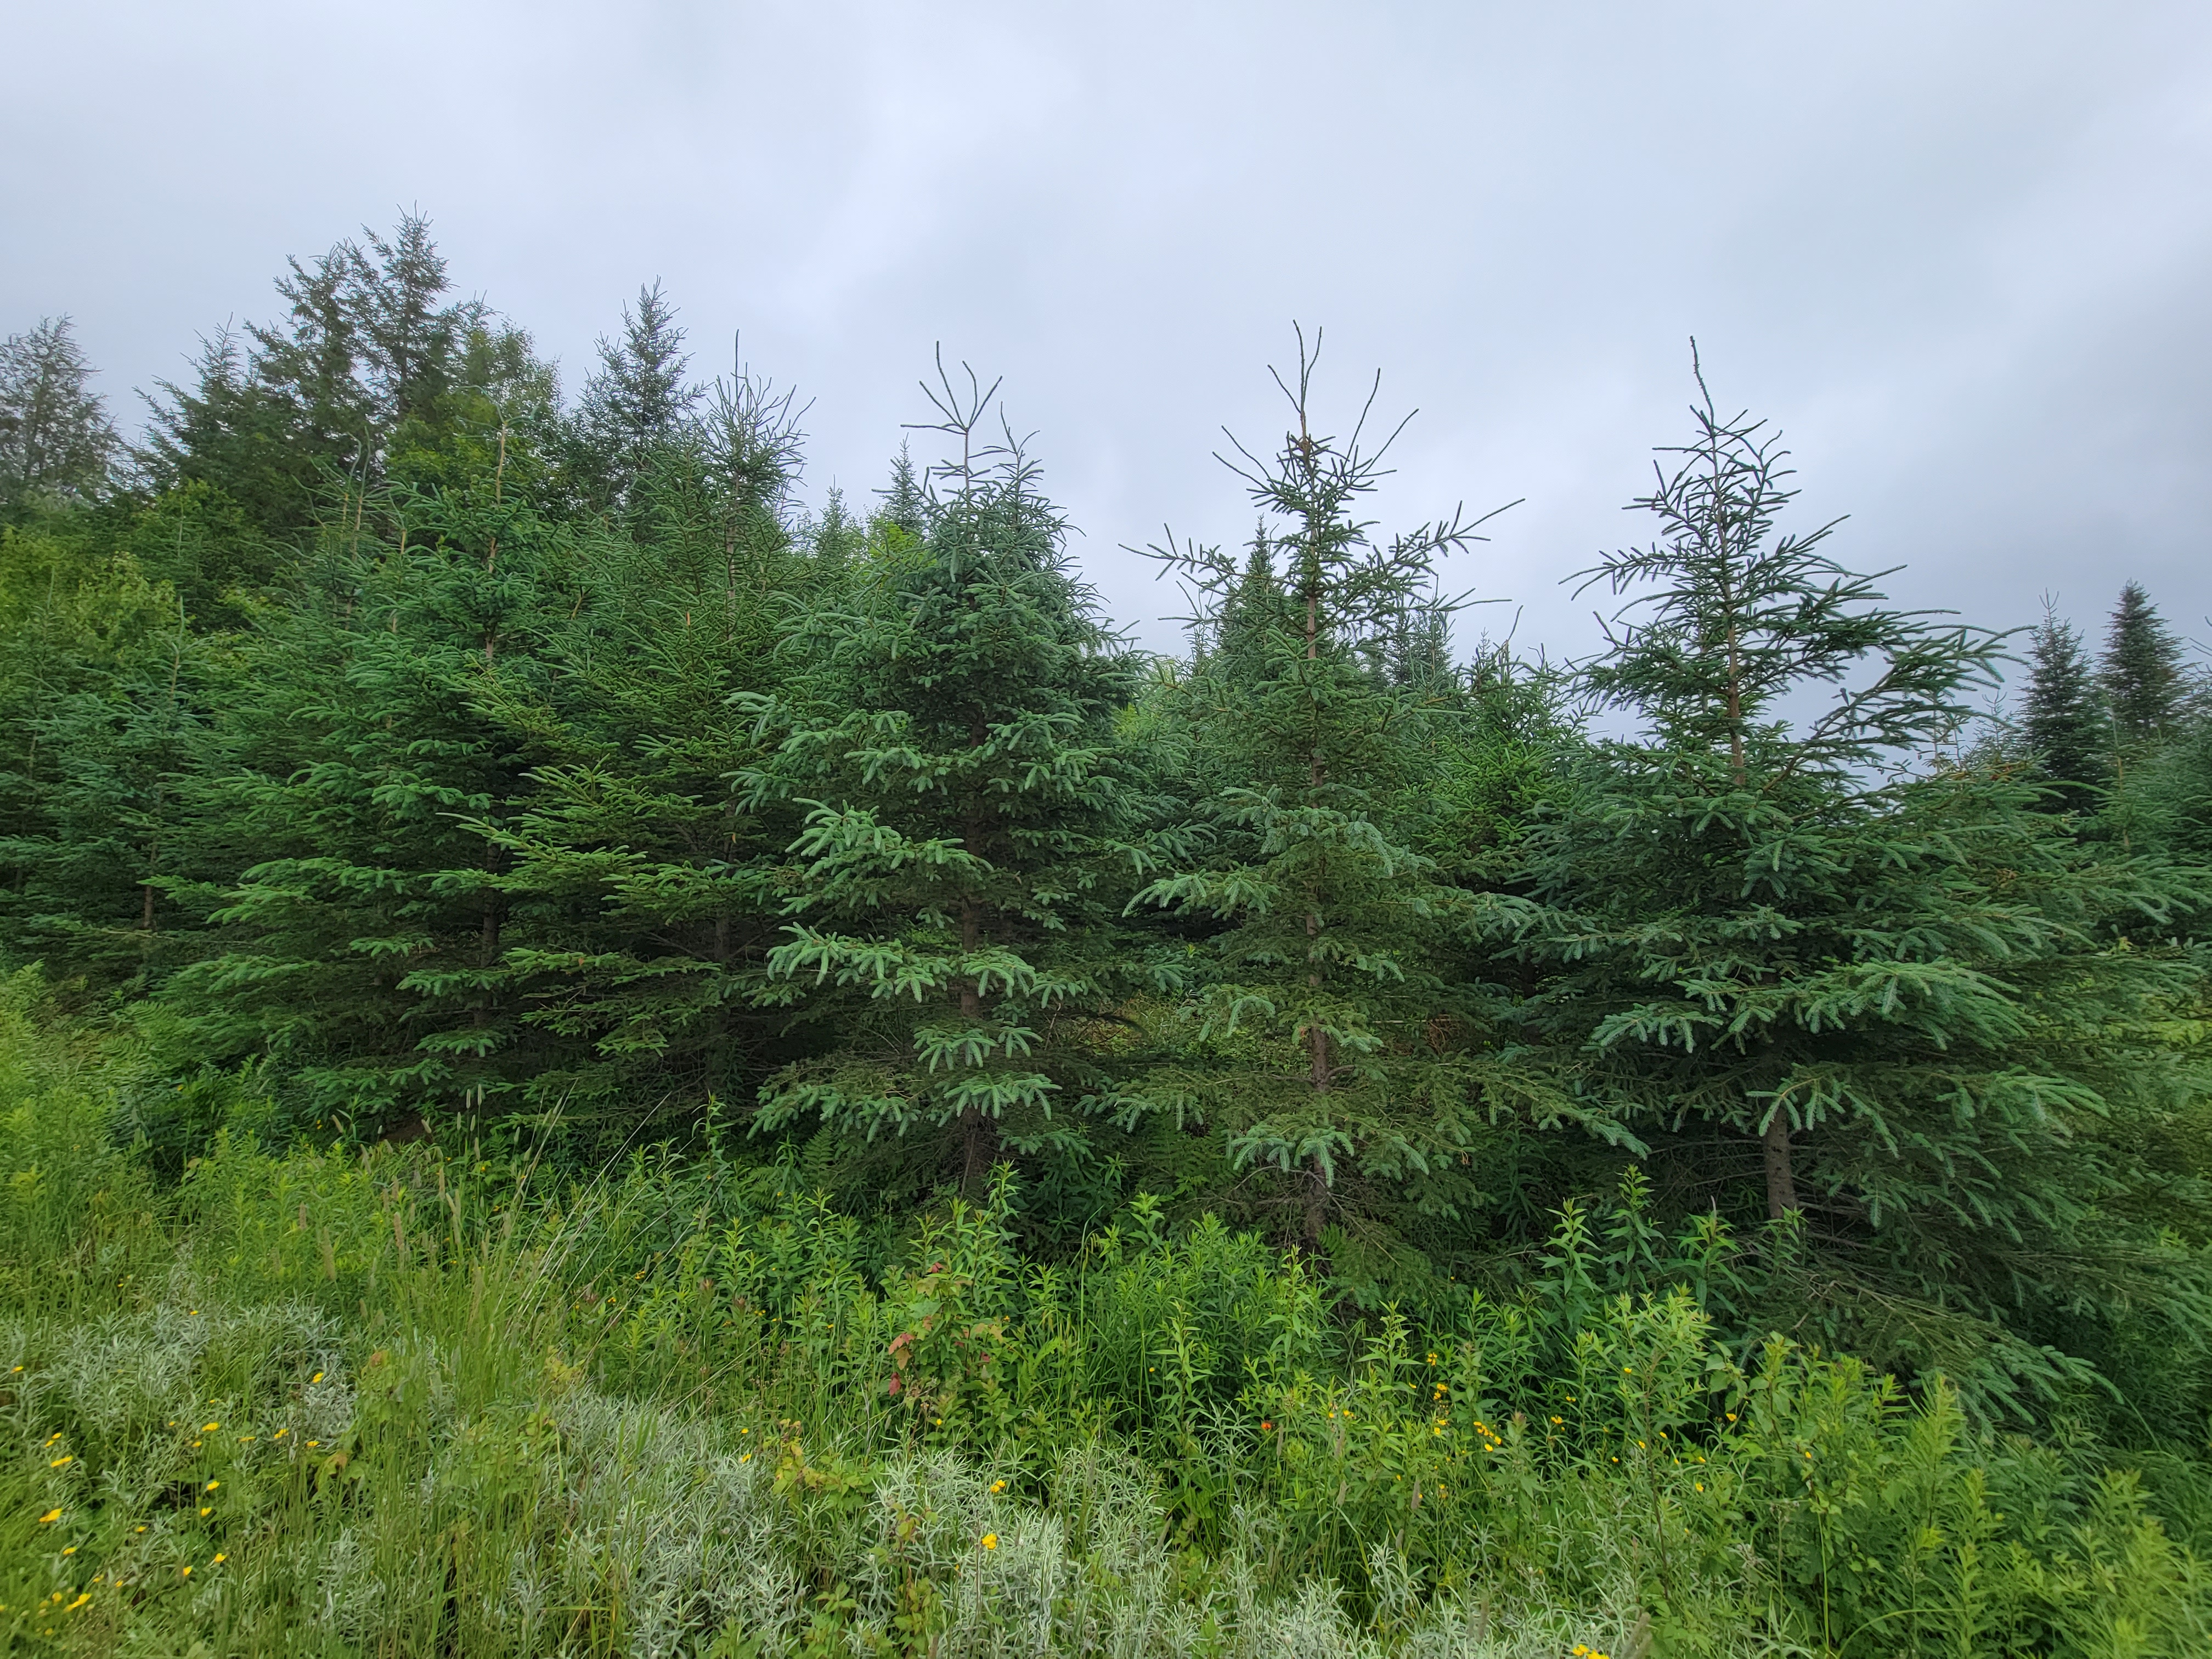
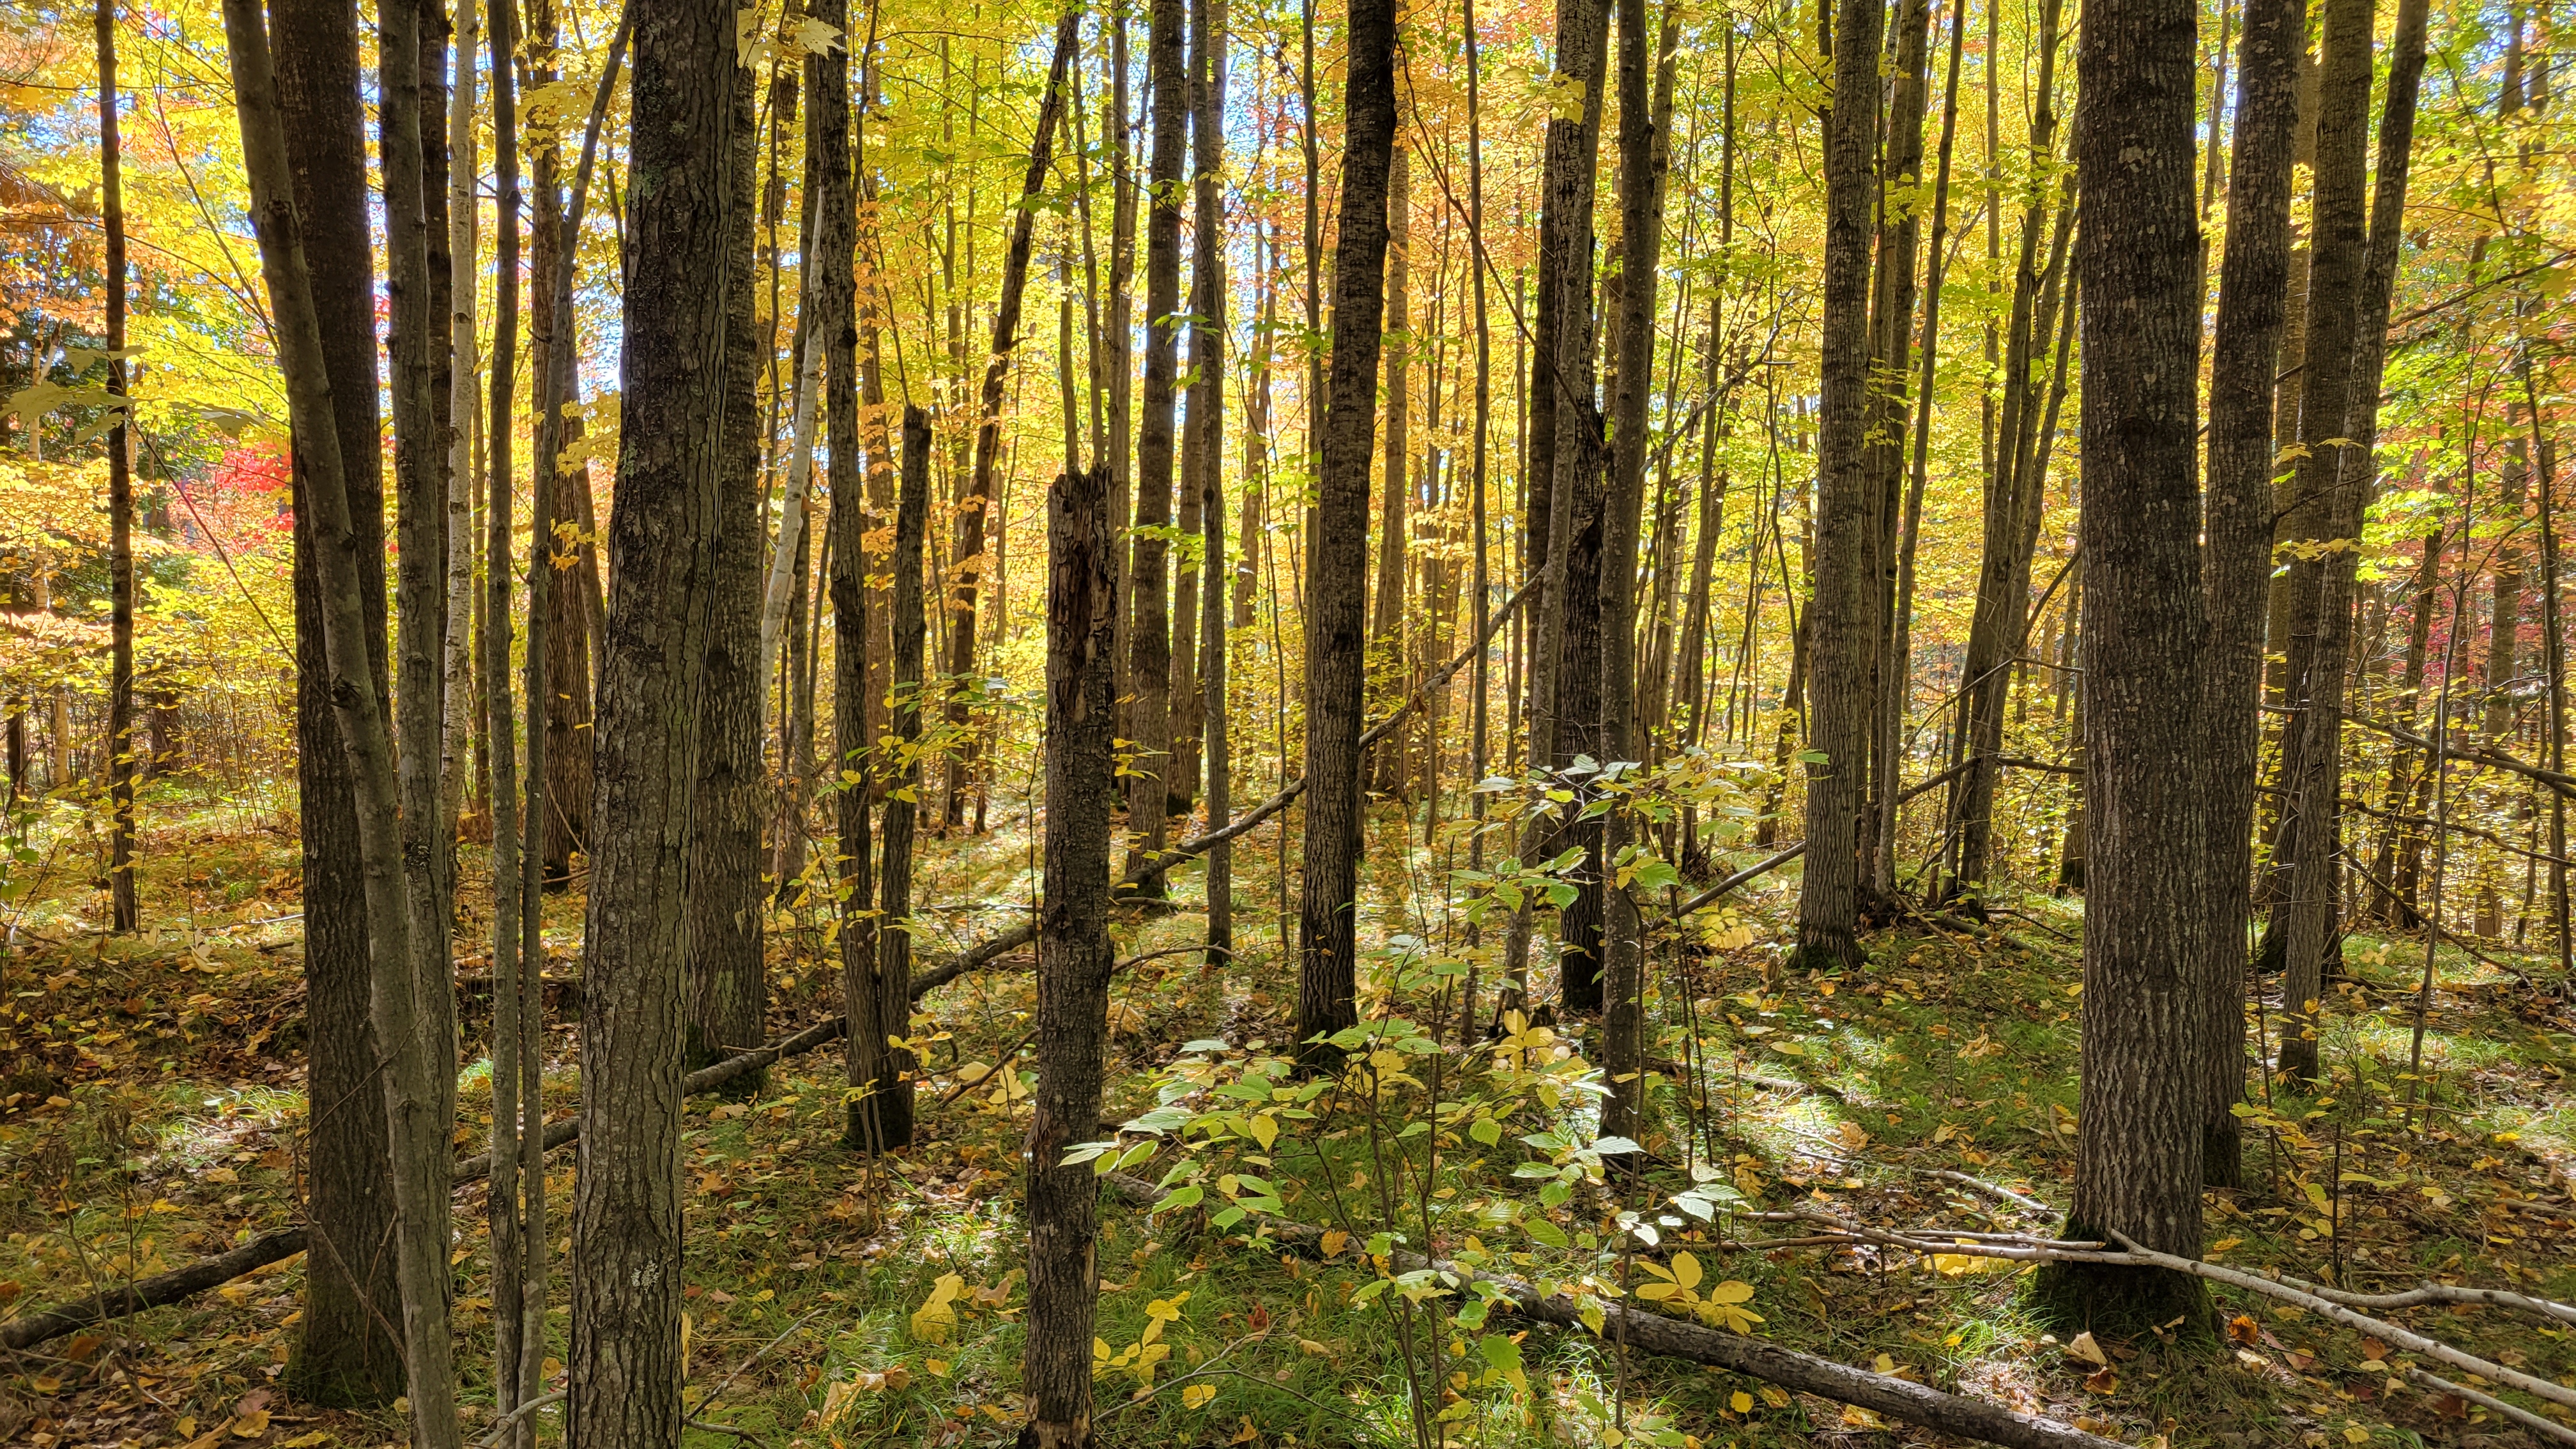
A peek into mixedwoods highlights their unique characteristics.
Approximately 1.77 million US homes heat with wood, a value that has been decreasing in recent years.
New data dashboard highlights over 20 years of stumpage prices in Maine.
Comparing biomass remaining in wood in harvested wood products versus dead wood.
With the rise of AI and automated coding platforms, don’t discount the vibe coder.
A metric that provides an objective approach to understanding different types of thinning.
The type of thinning, (e.g., from below, throughout, or above the diameter distribution), plays an important role in future forest carbon stocks.
Extreme value analyses can quantify the distribution of intense events that have a very low probability of occurrence.
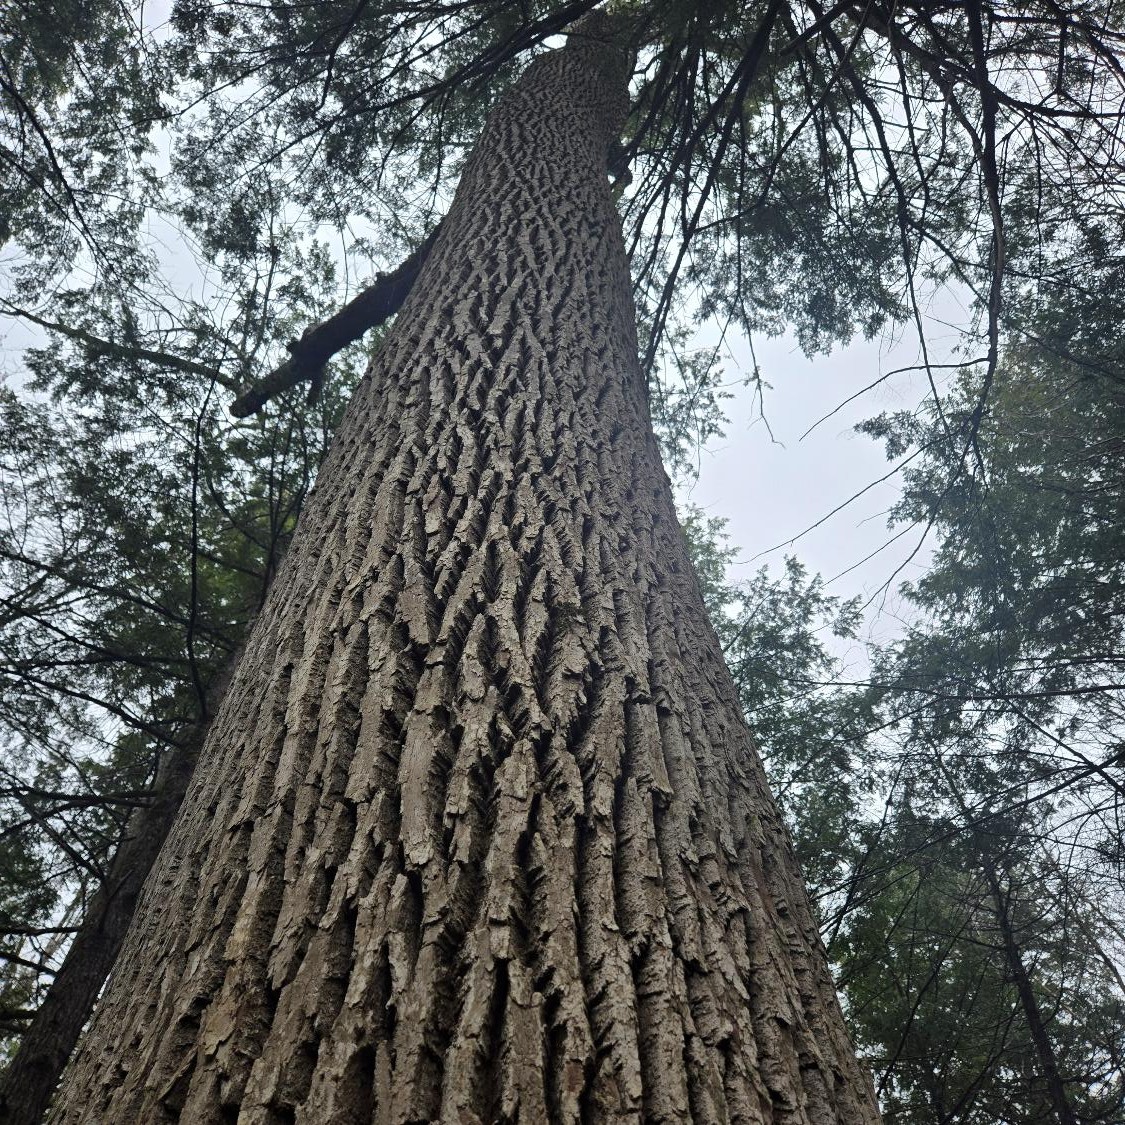
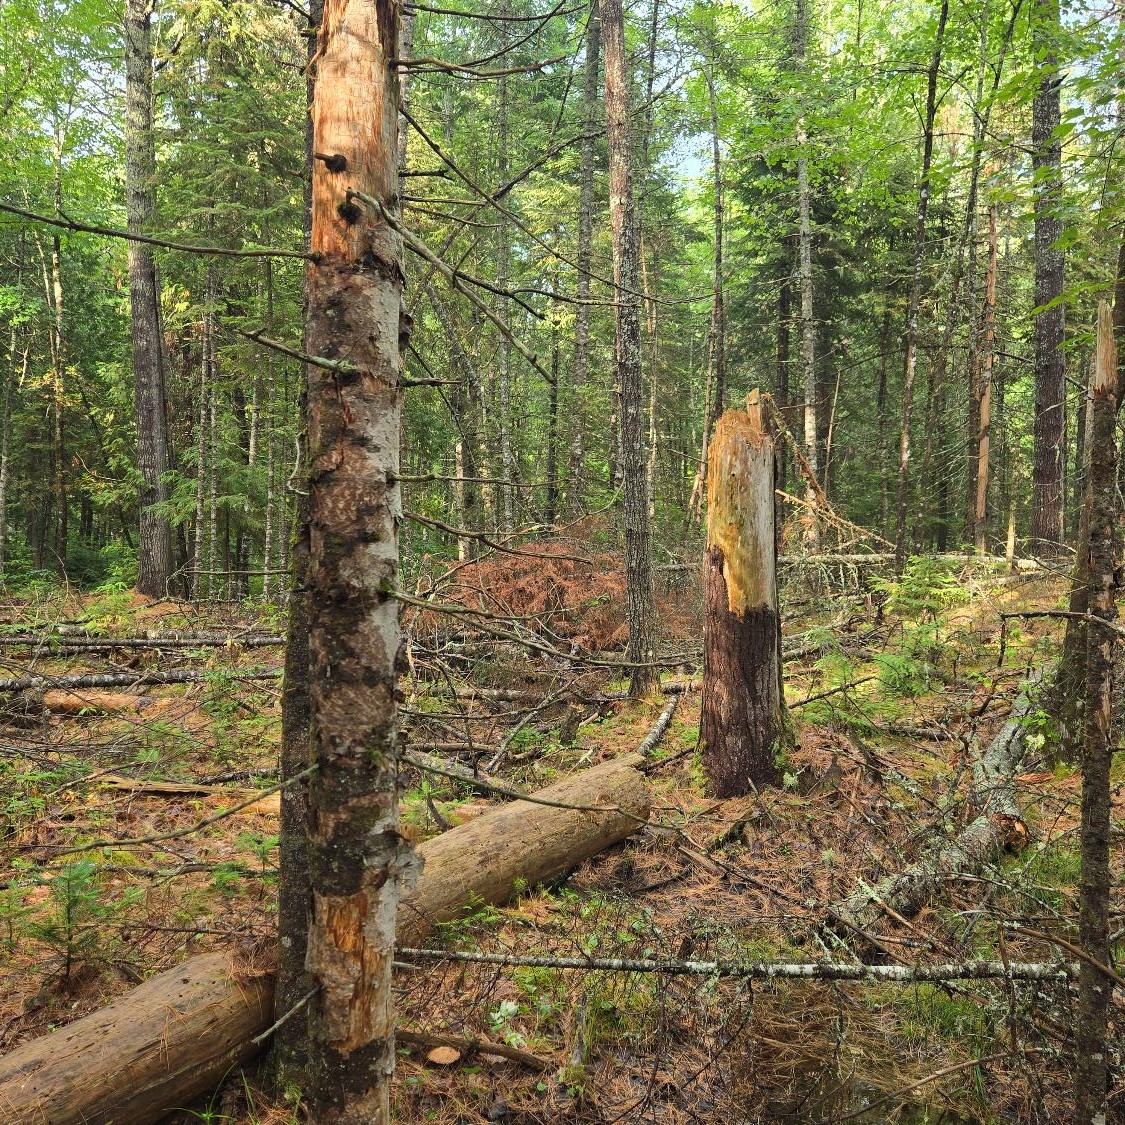
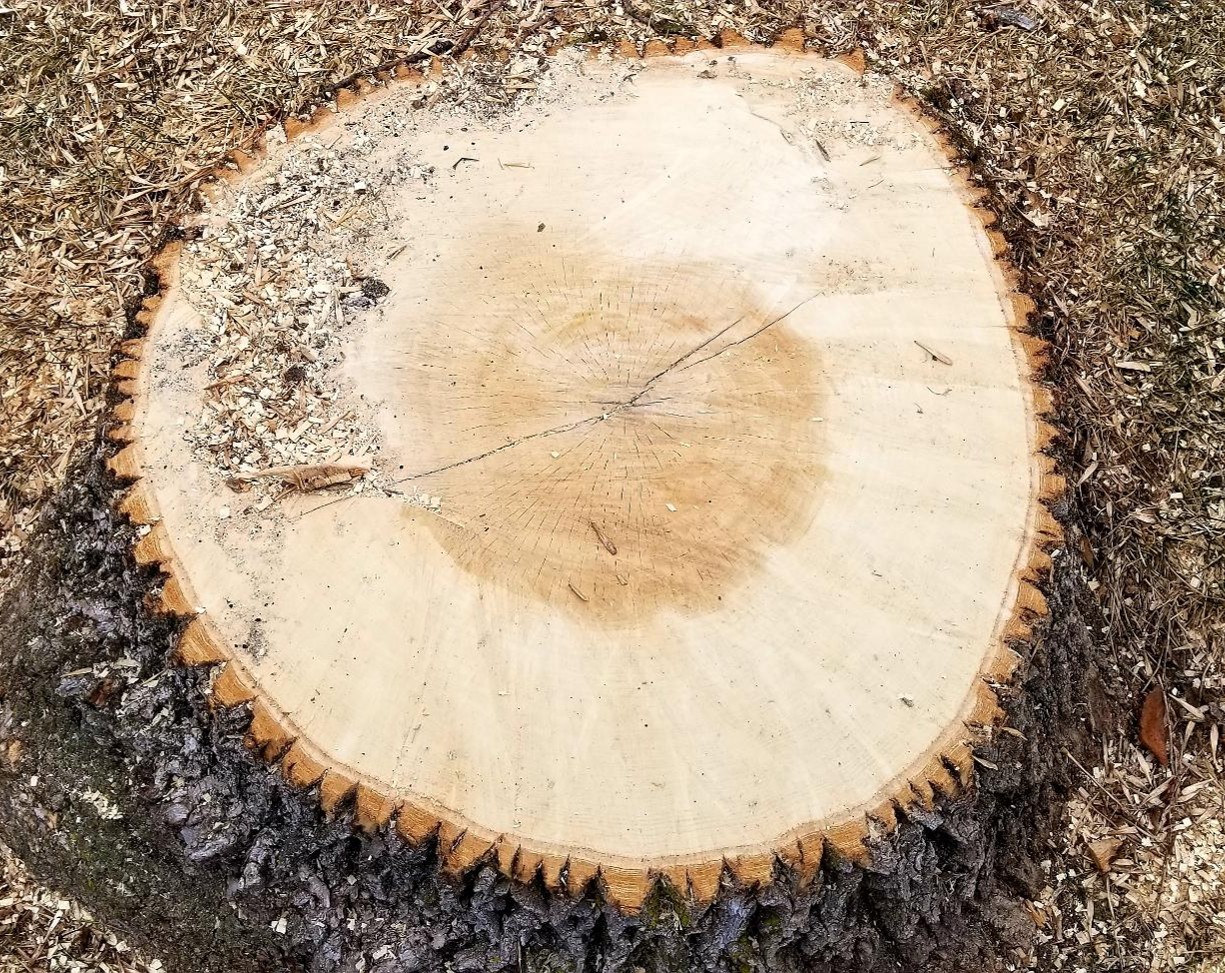
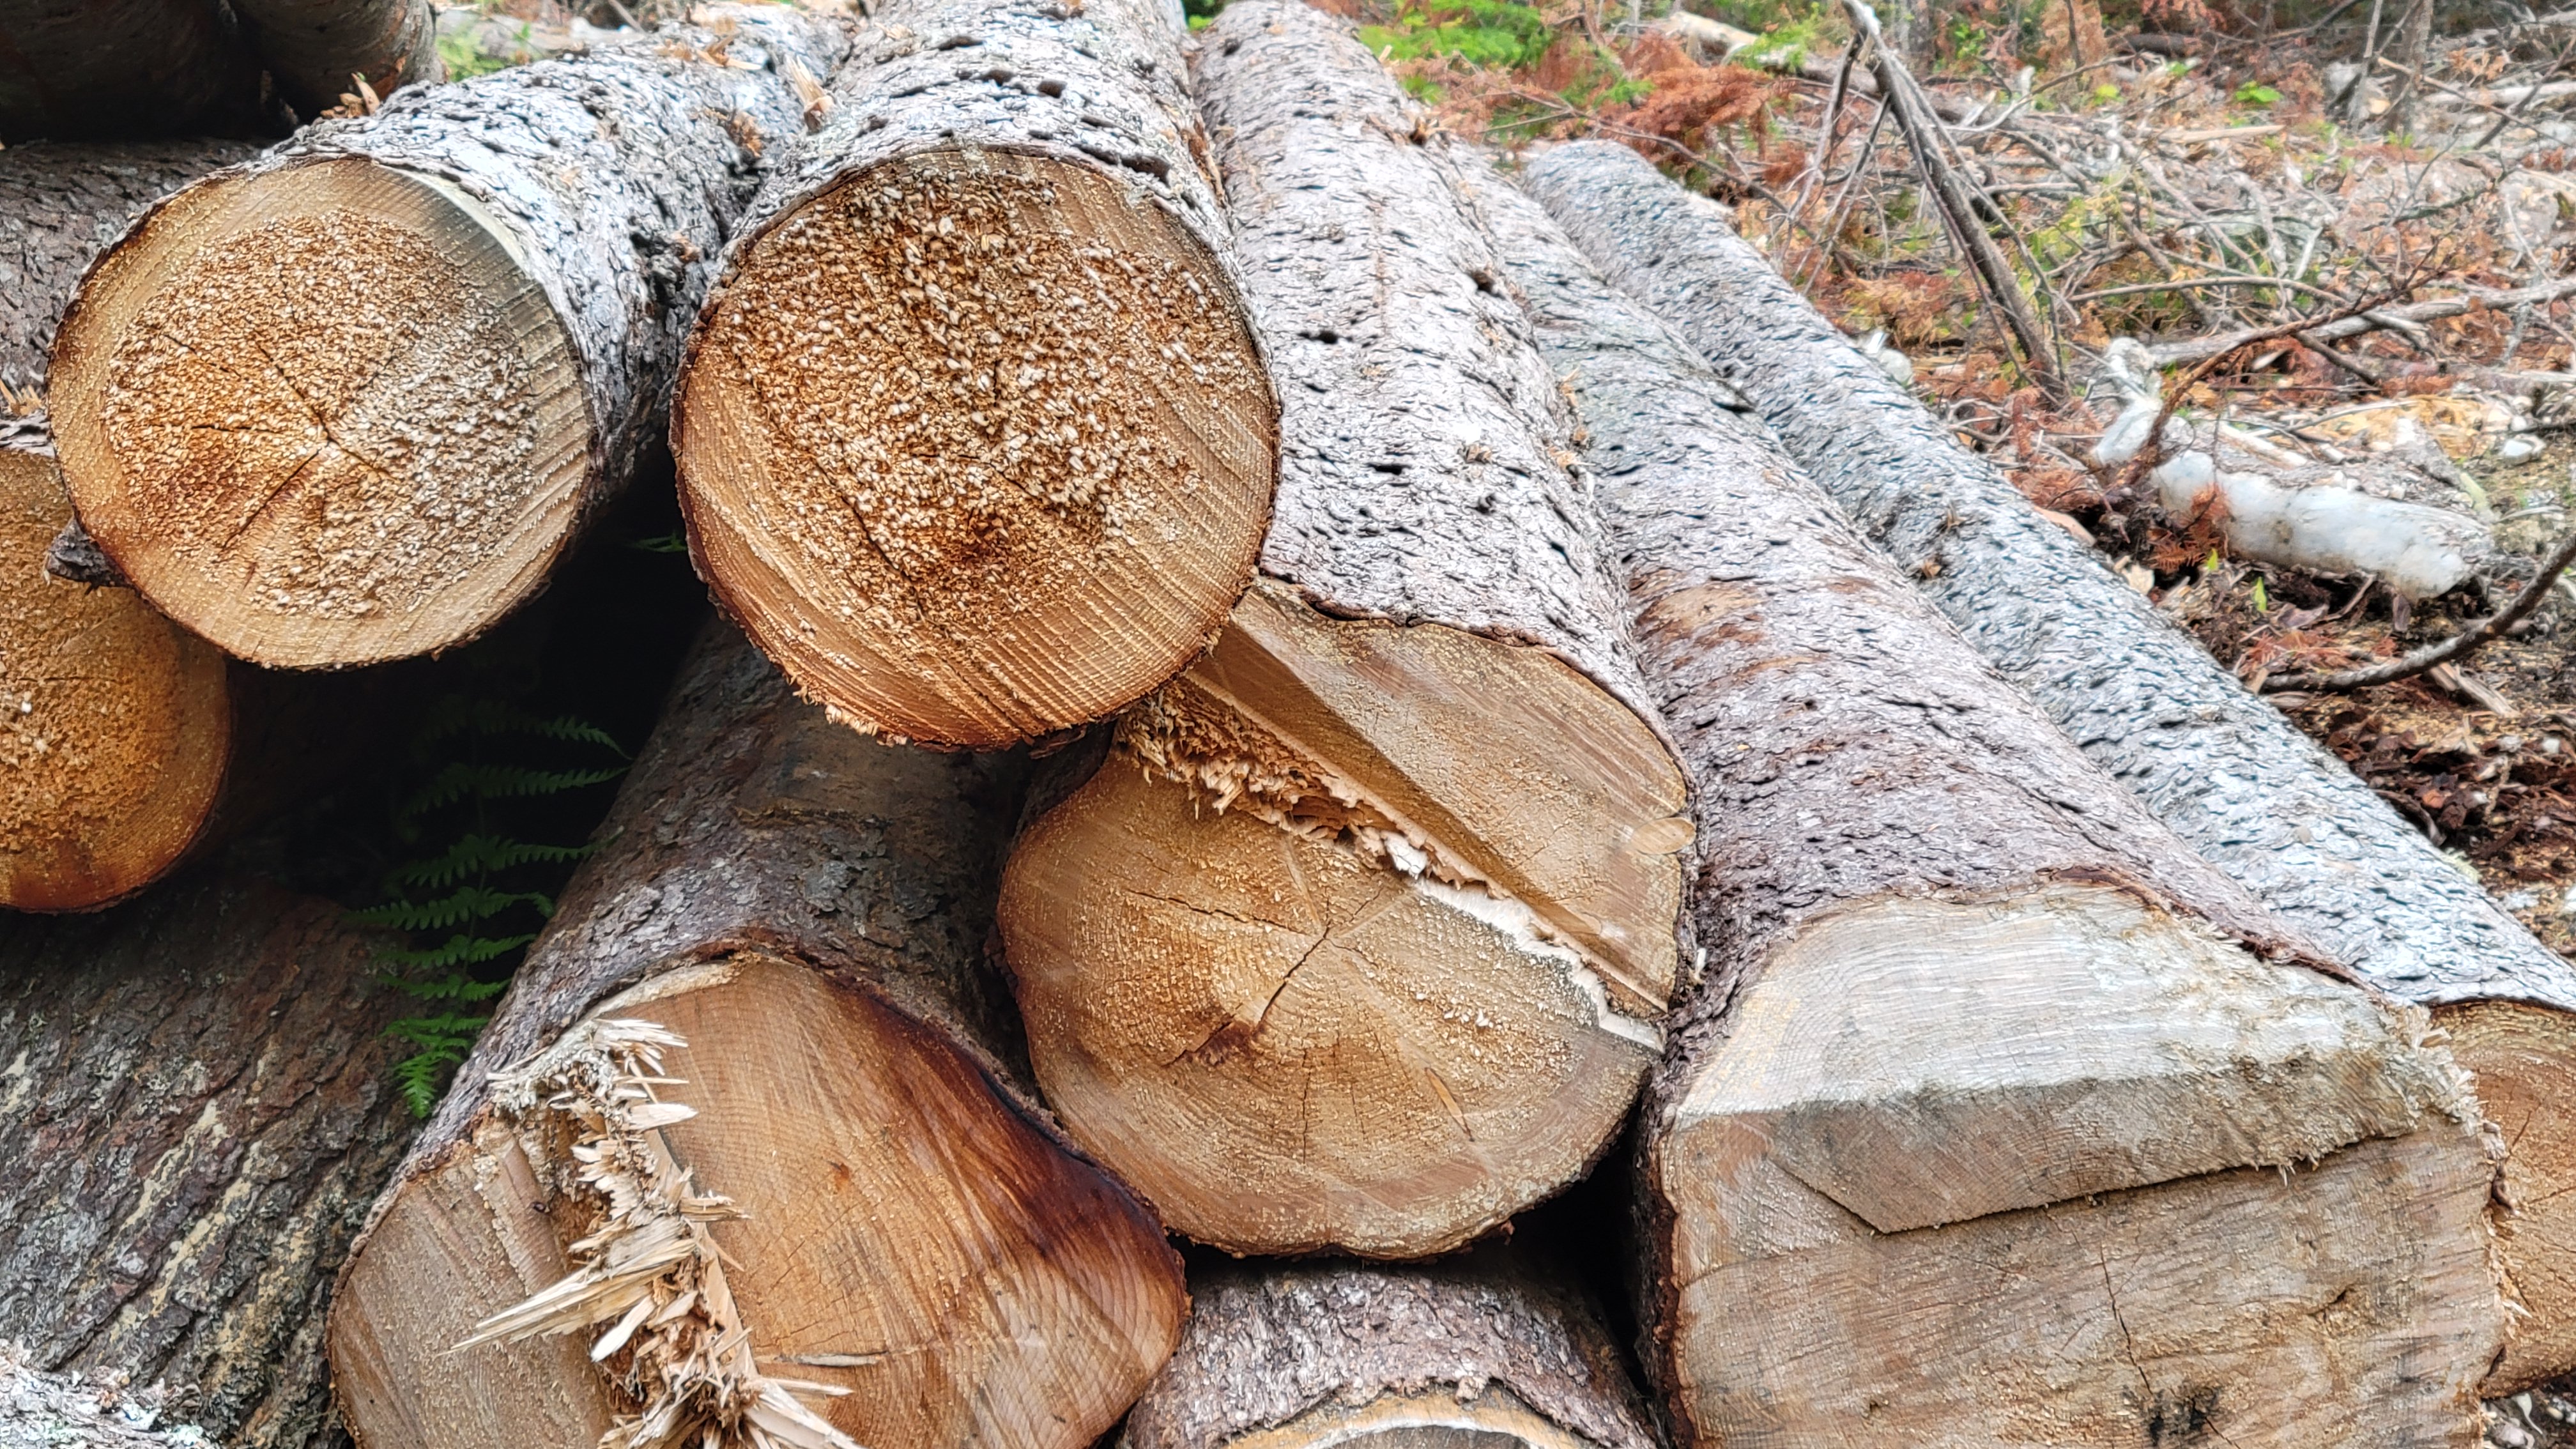
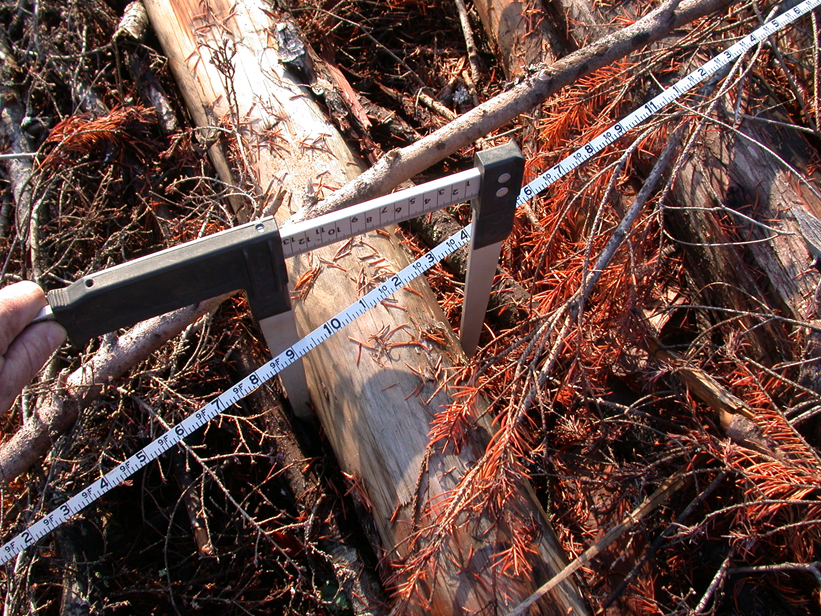
Field measurements that portray the defect of a tree can be used to dial in estimates of tree biomass and carbon.
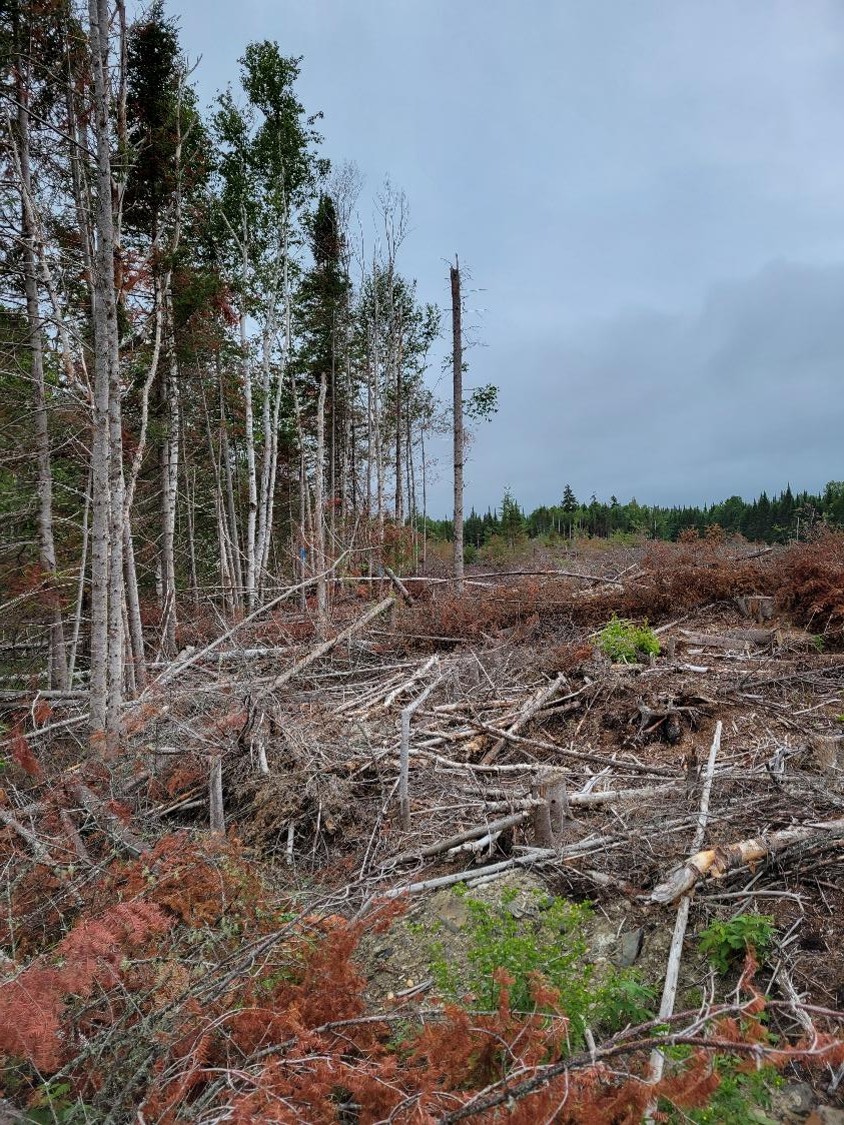
Historical data quantify the decrease in harvest volume in the past three decades.
Regeneration is not a component of many geographics variants of the FVS model, but including it can have a big impact on long-term predictions of forest carbon.
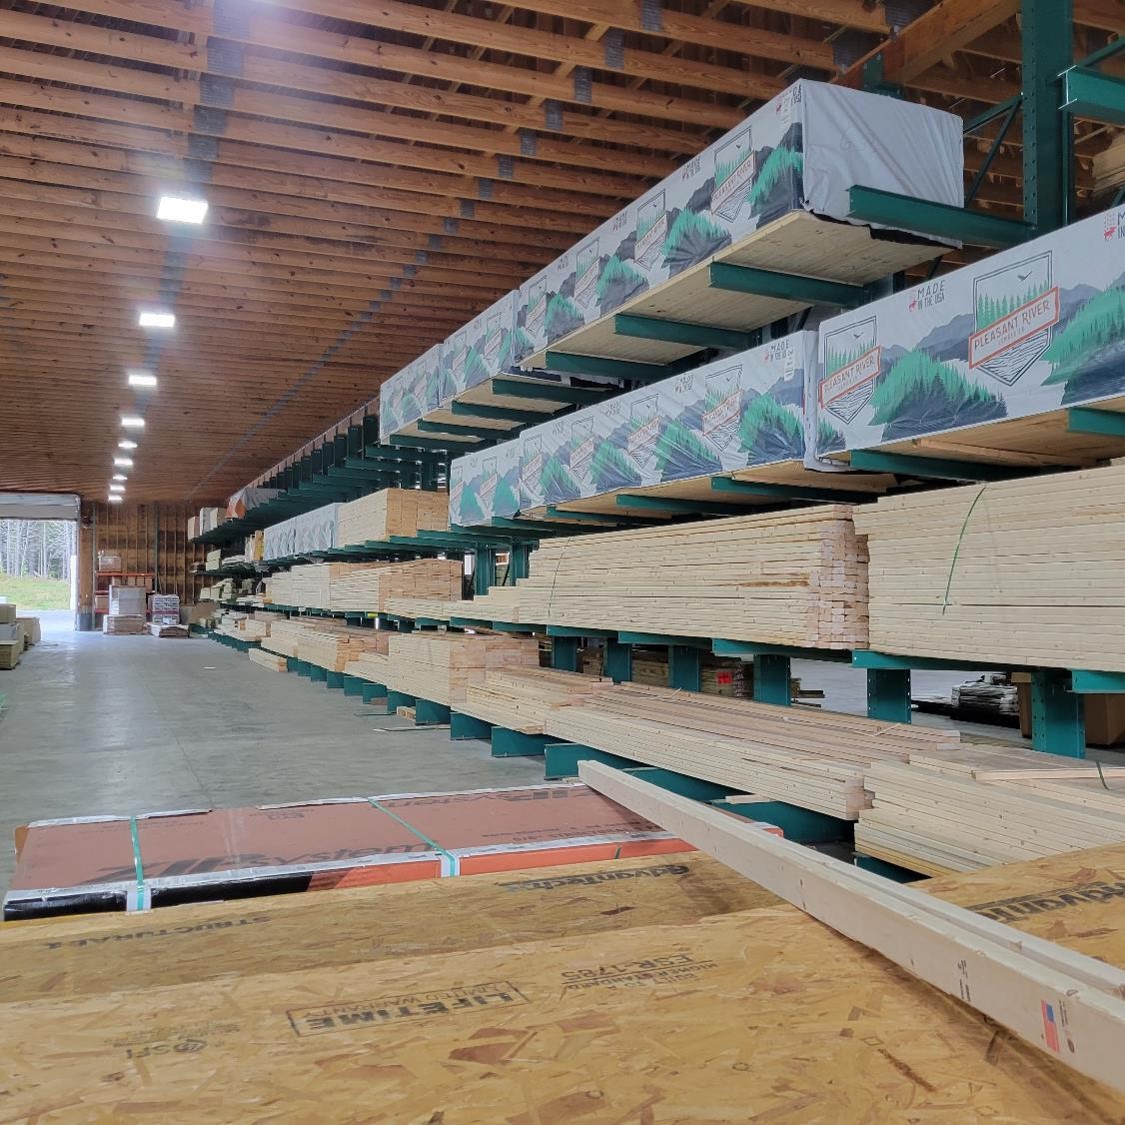
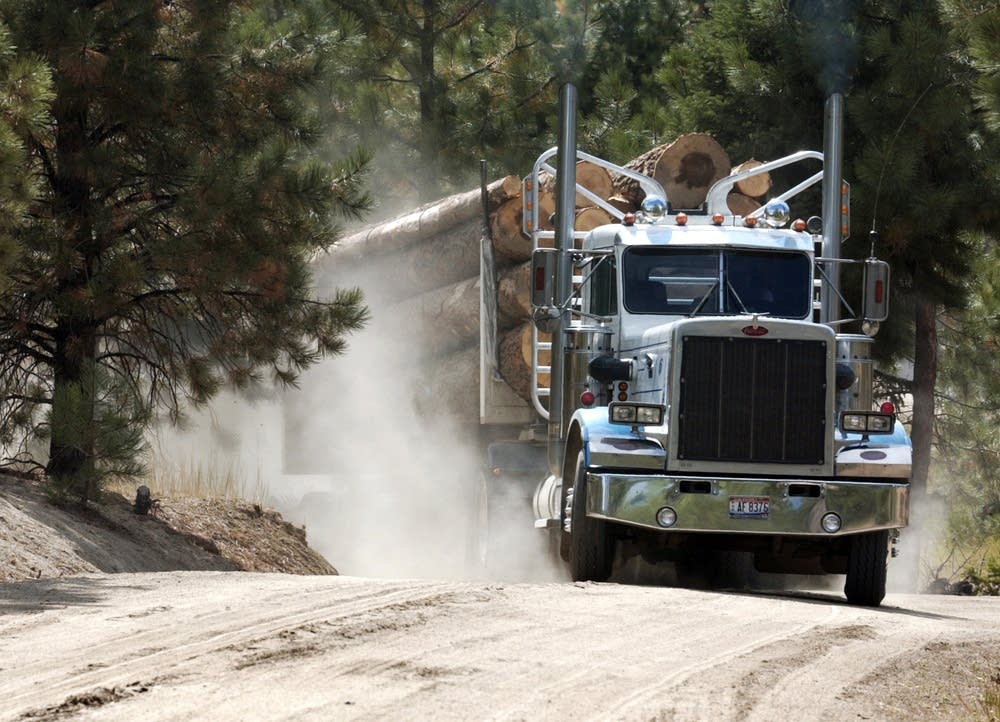
Reducing the wait times of wood deliveries is a priority for wood procurement managers and suppliers.
Gauging the performance of a simple approximation.
Adventures in using an AI-powered paired programming
Looking to grow the analytics team.
Comparing the benefits of equivalence testing with traditional uses of hypothesis tests in forestry.
A recap of our top posts and articles from 2024.
There’s no better way to understand harvest sustainability across a region than to calculate the growth/drain ratio.
Understanding how much is harvested from a forest can help understand carbon storage.
Understanding how growth is calculated can help unravel the drivers of forest carbon change.
On the importance of understanding one-boxing as it relates to AI and original content.
Comparing non-calibrated out-of-the-box FVS predictions with a version that modifies mortality.
If you’re familiar with the tidyverse and you also have a need to fit models to data, you’ll love tidymodels.
Companies that emit carbon may seek to pay for quality carbon credits that come from forests in their backyard.
A look at the differences in longevity between harvested wood products of softwood and hardwood species.
The Arbor Custom Analytics website now runs on Quarto, an open source publishing system for sharing information.
Here’s a primer on forest carbon sequestration values and how much carbon US forests grow on an annual basis.
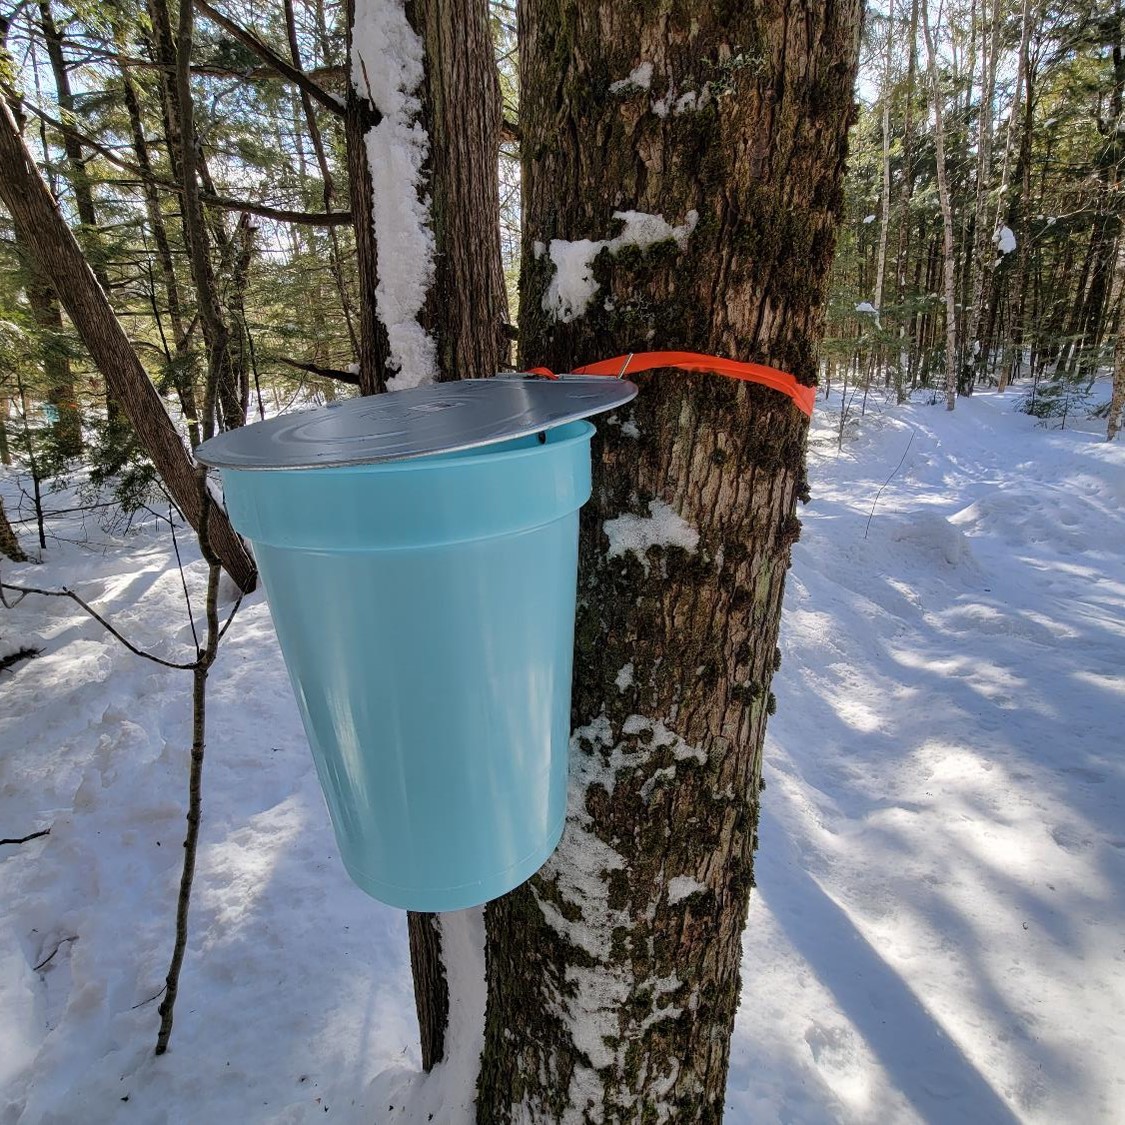
The data behind our amateur maple syrup operations.
A few initial thoughts on using the new NSVB equations.
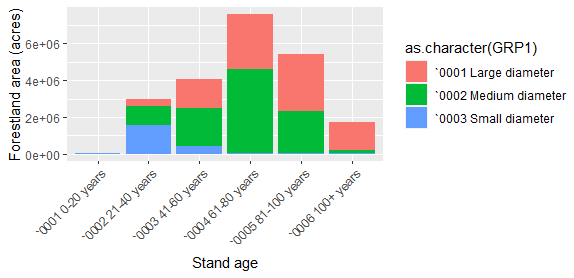
How to estimate forestland area change.
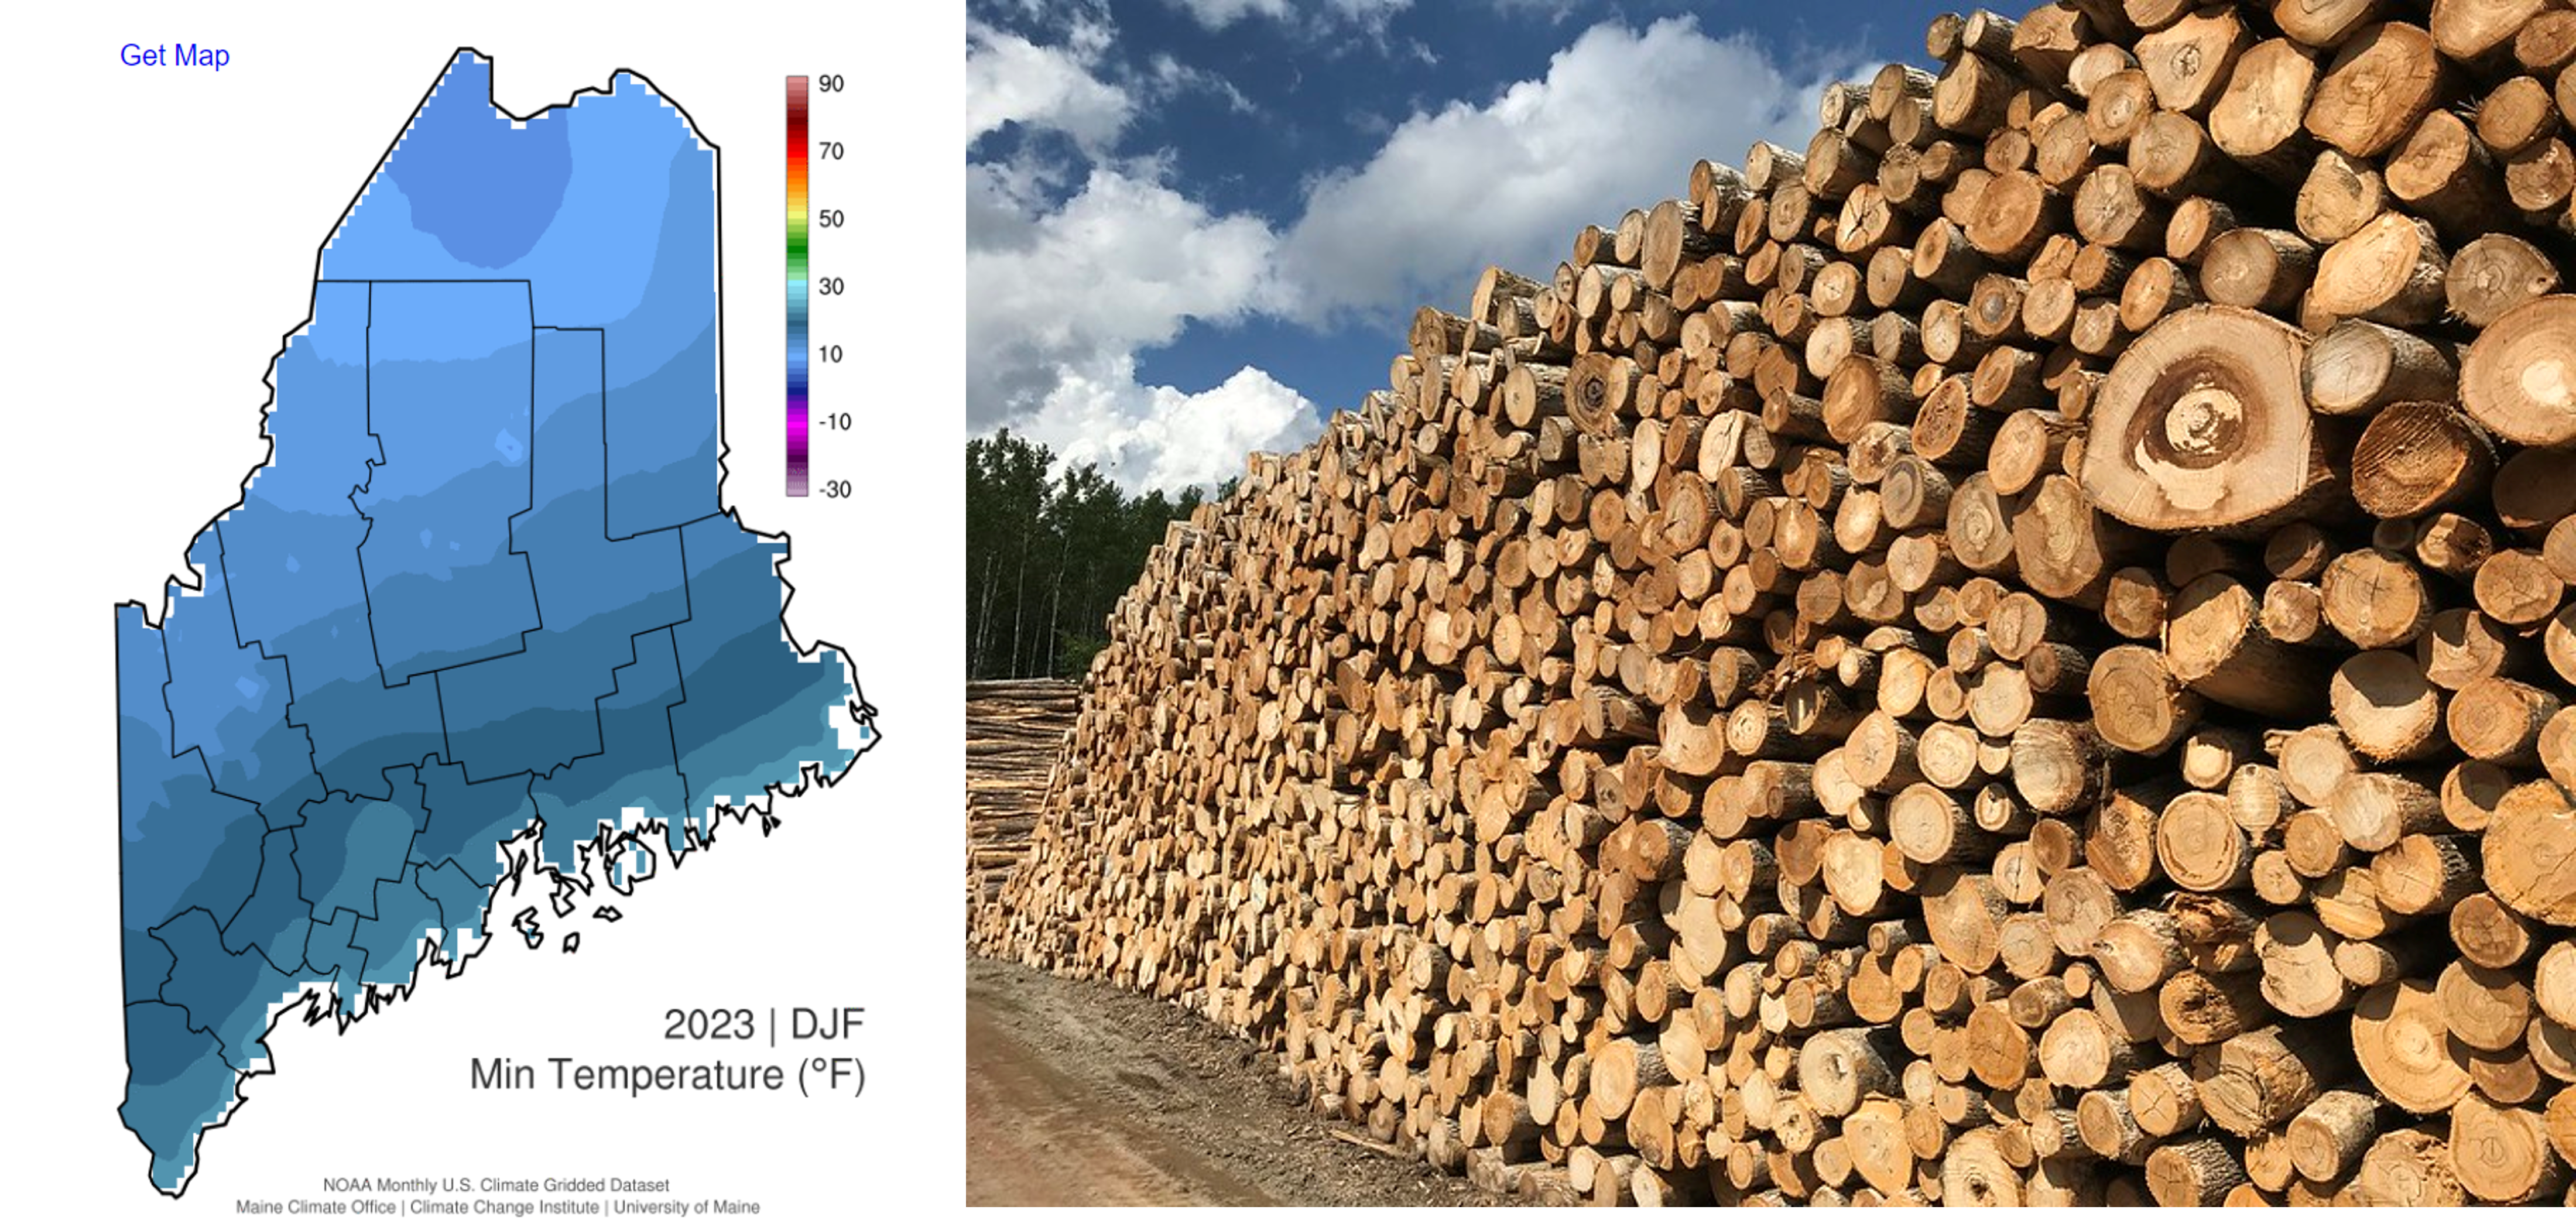
Looking at the correlation between stumpage prices and Maine winters.
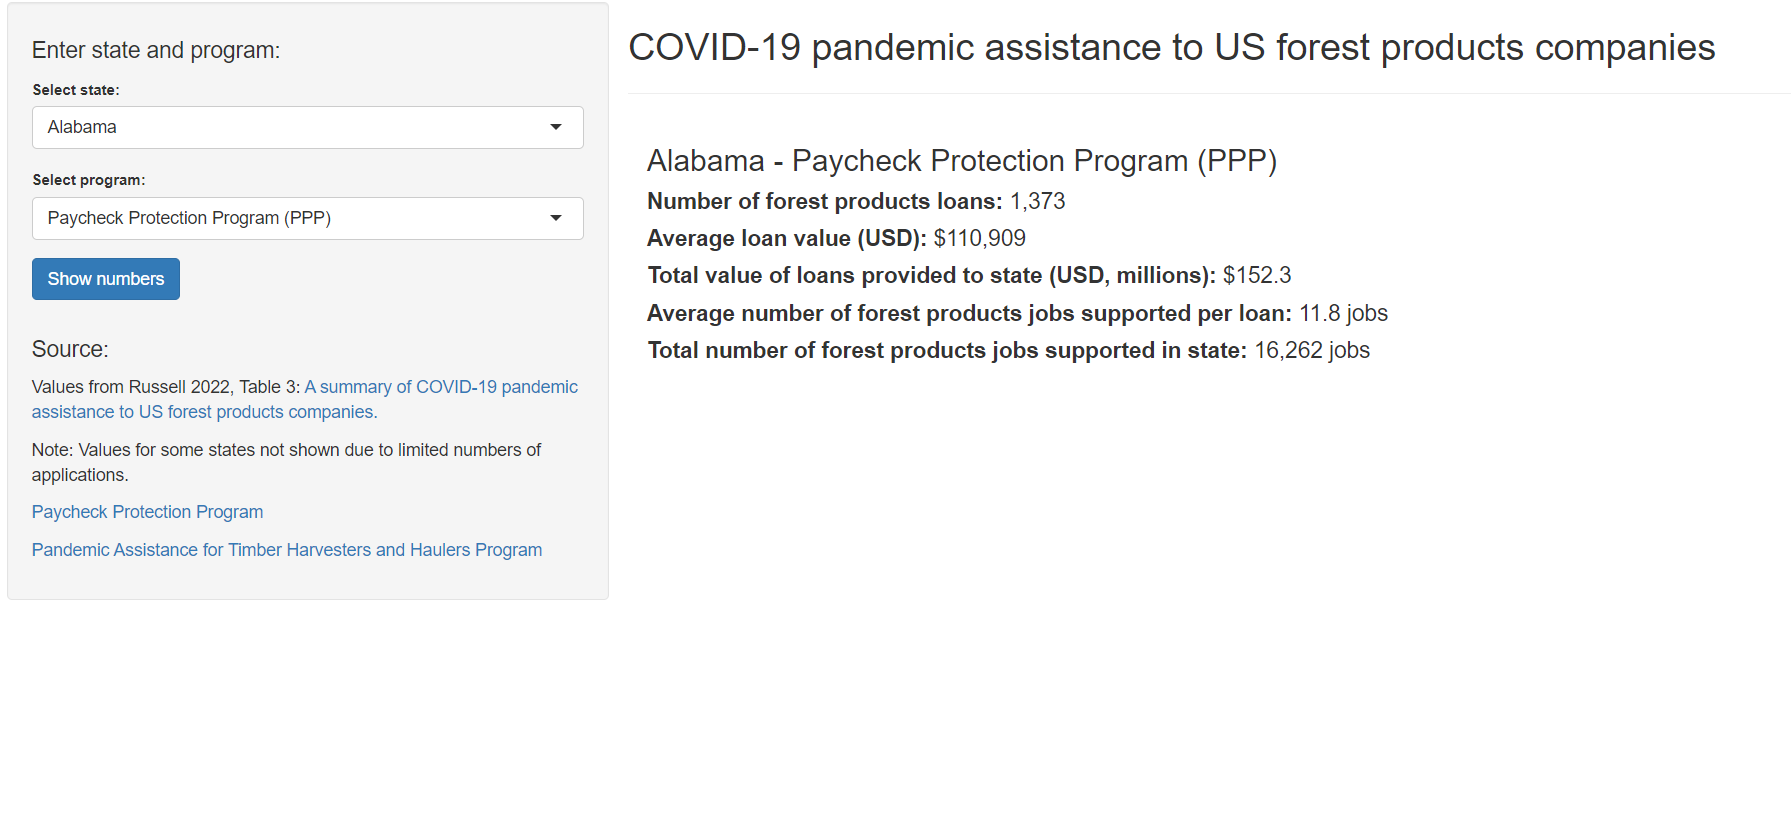
Forest products companies and their use of PPP loans and PATHH payments.
A rundown of the most popular content from this year.
Data, measurements, and fun facts about the Rockefeller Center Christmas Tree.
A handy list of packages for R users in the forestry community.
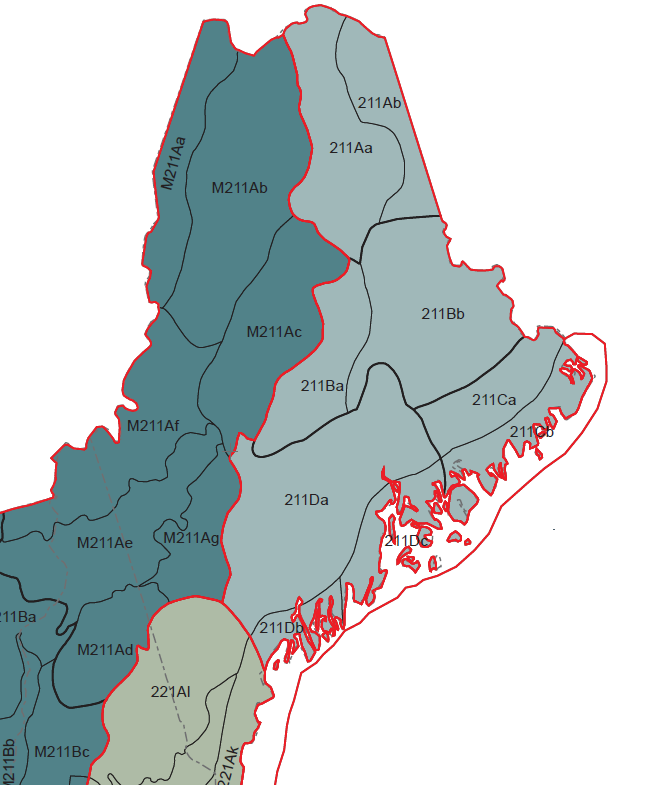
Some functions from the R’s stringr package to obtain ecological division.
Comparing non-calibrated out-of-the-box FVS predictions with a calibrated version.
New ways to access FIA estimates through R and Python.
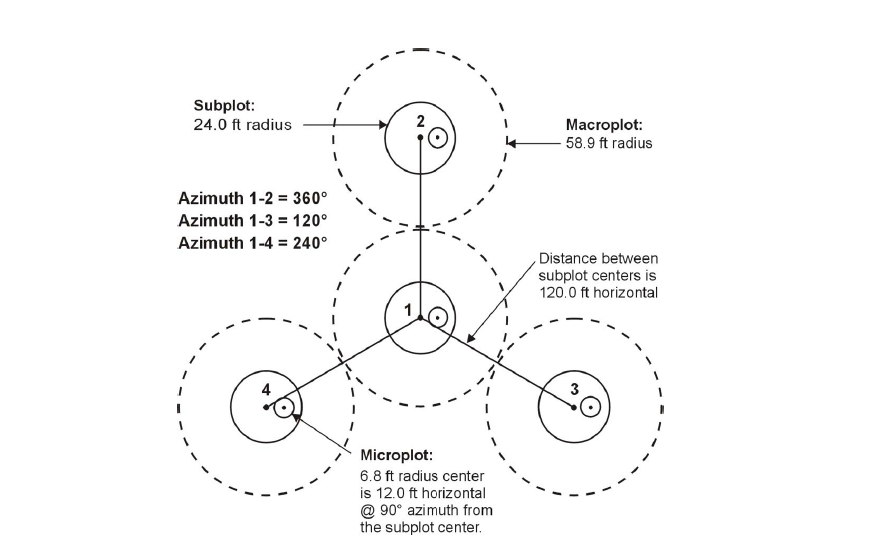
How to allocate field plots to measure forest carbon under a stratified random sampling framework.
A few key updates from Teaching the tidyverse in 2023
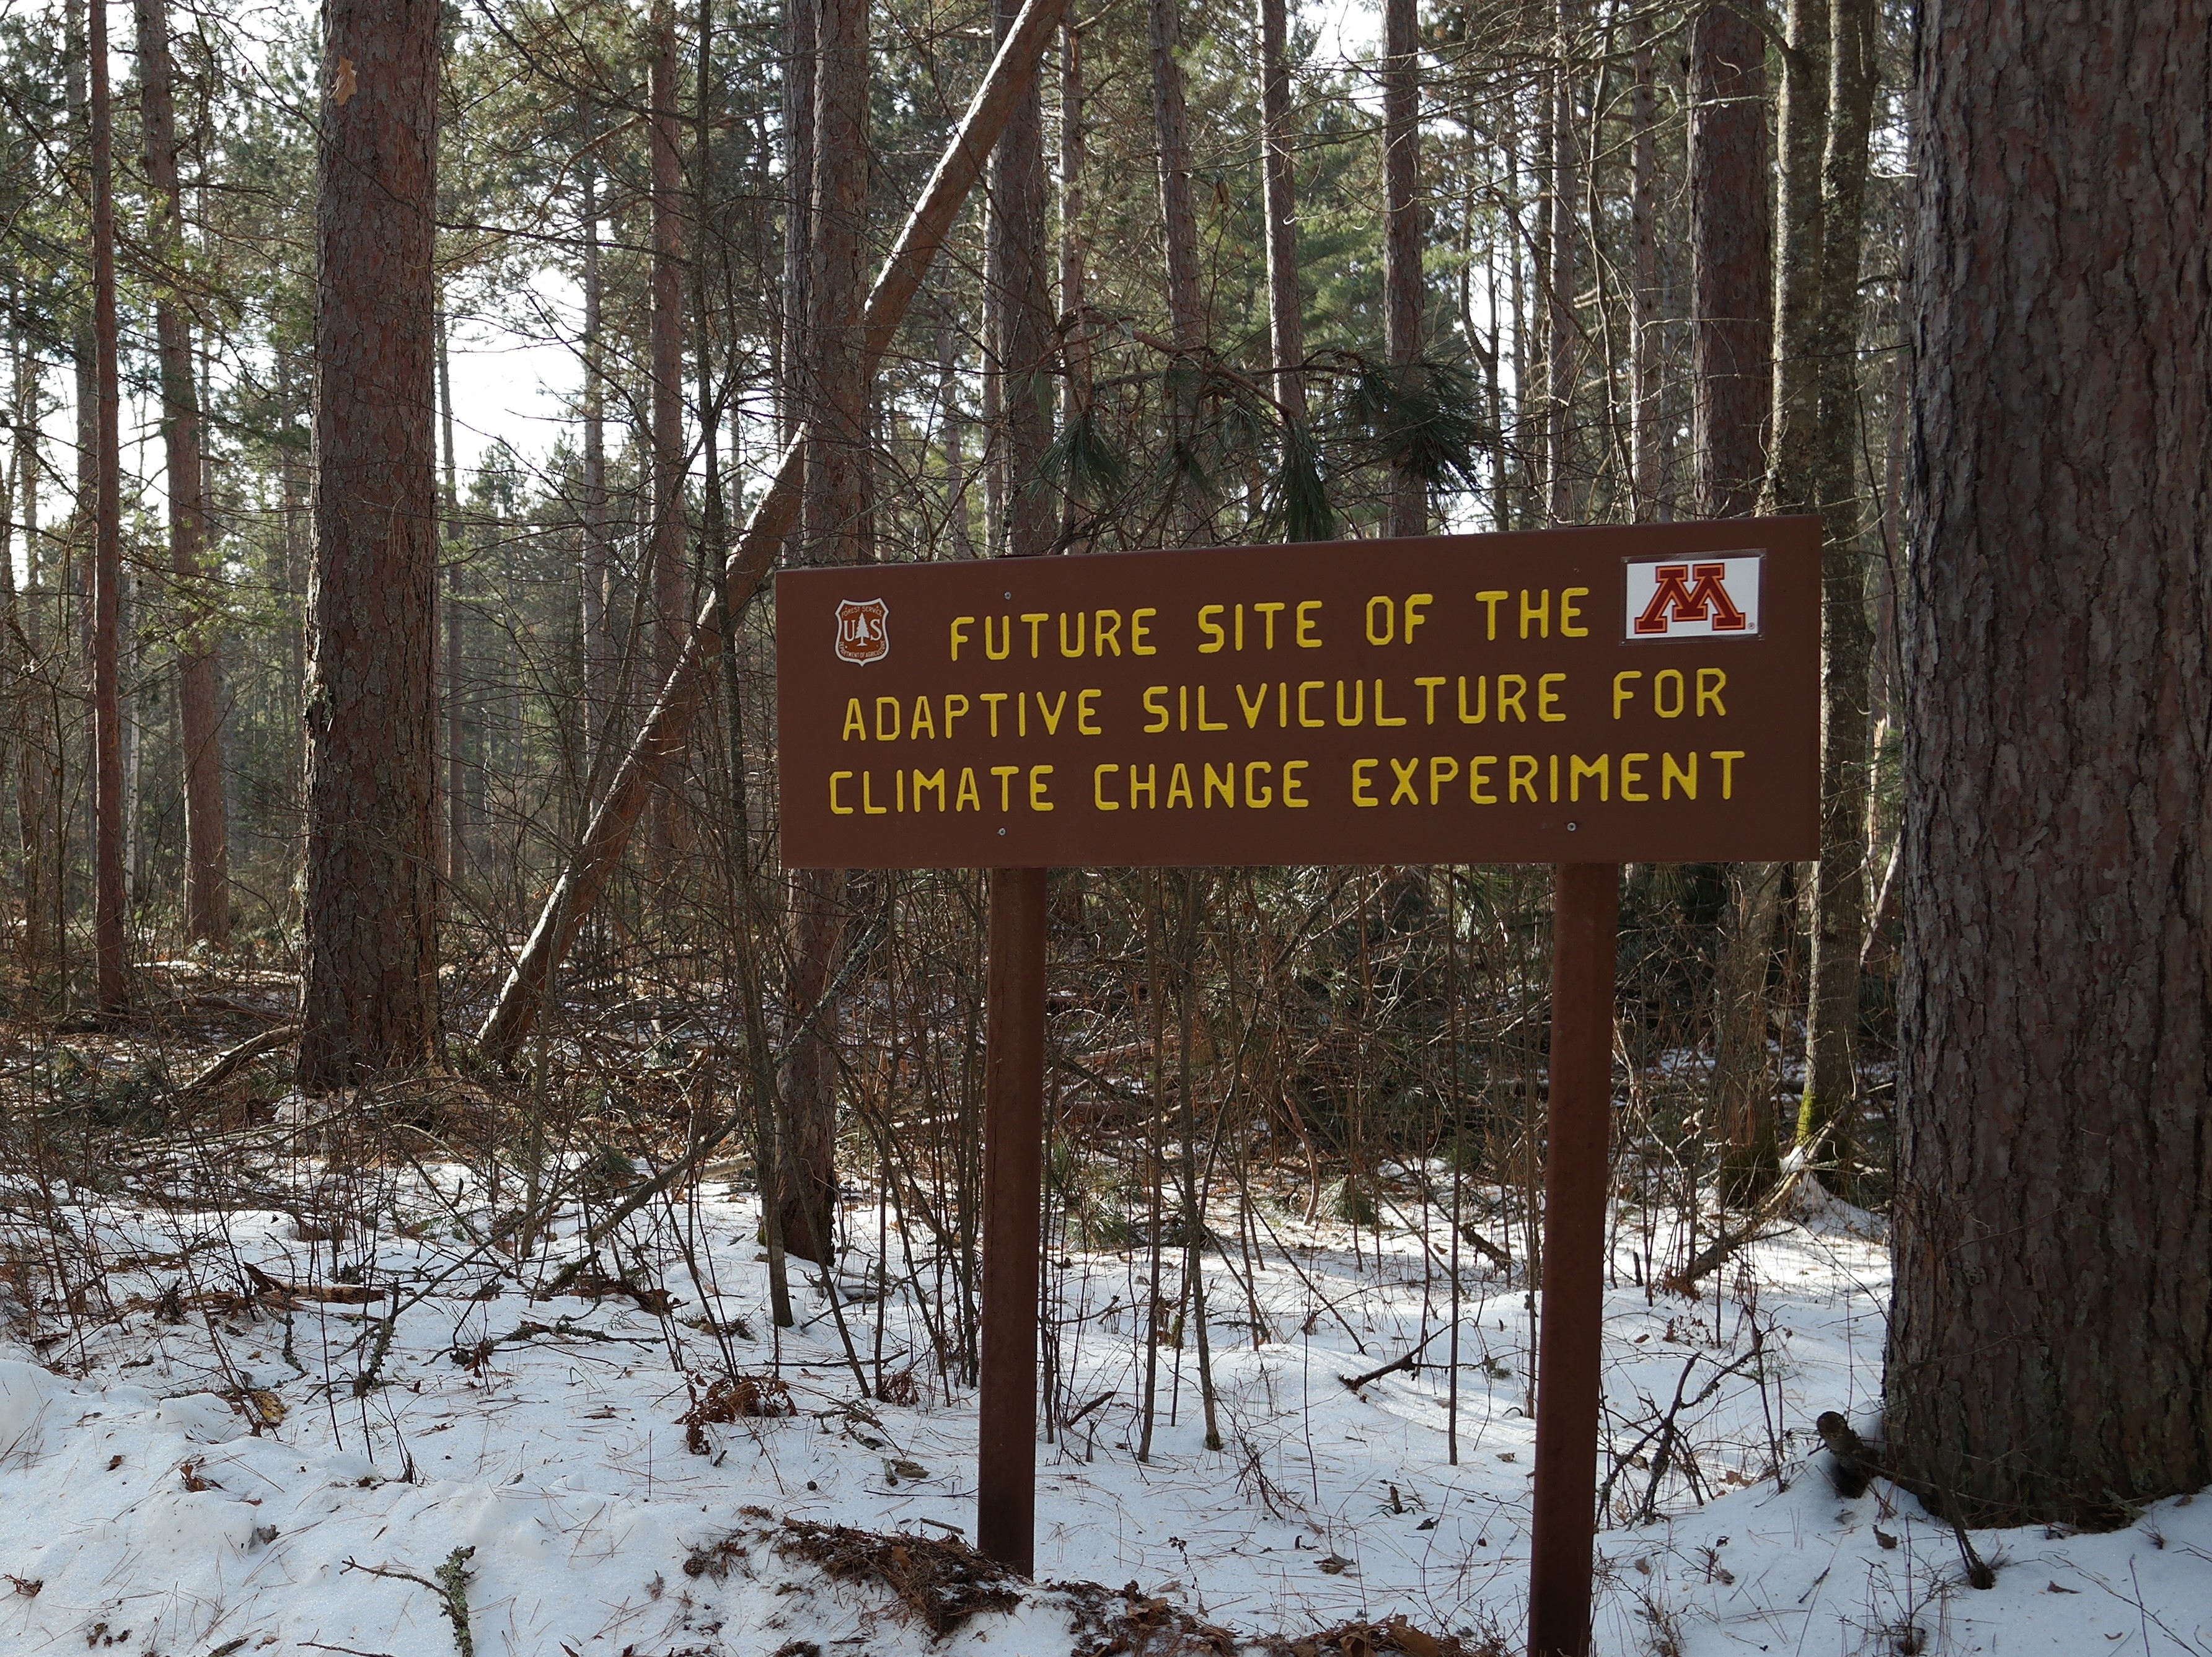
A tutorial on adaptive silviculture treatments in FVS.
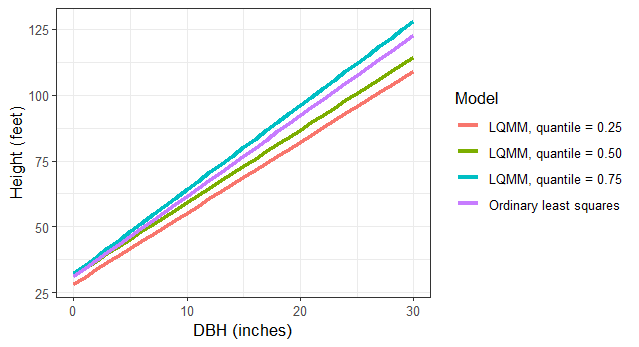
LQMM models provide a flexible structure to account for random effects
I had mixed feelings about making the solutions for exercises available to learners.
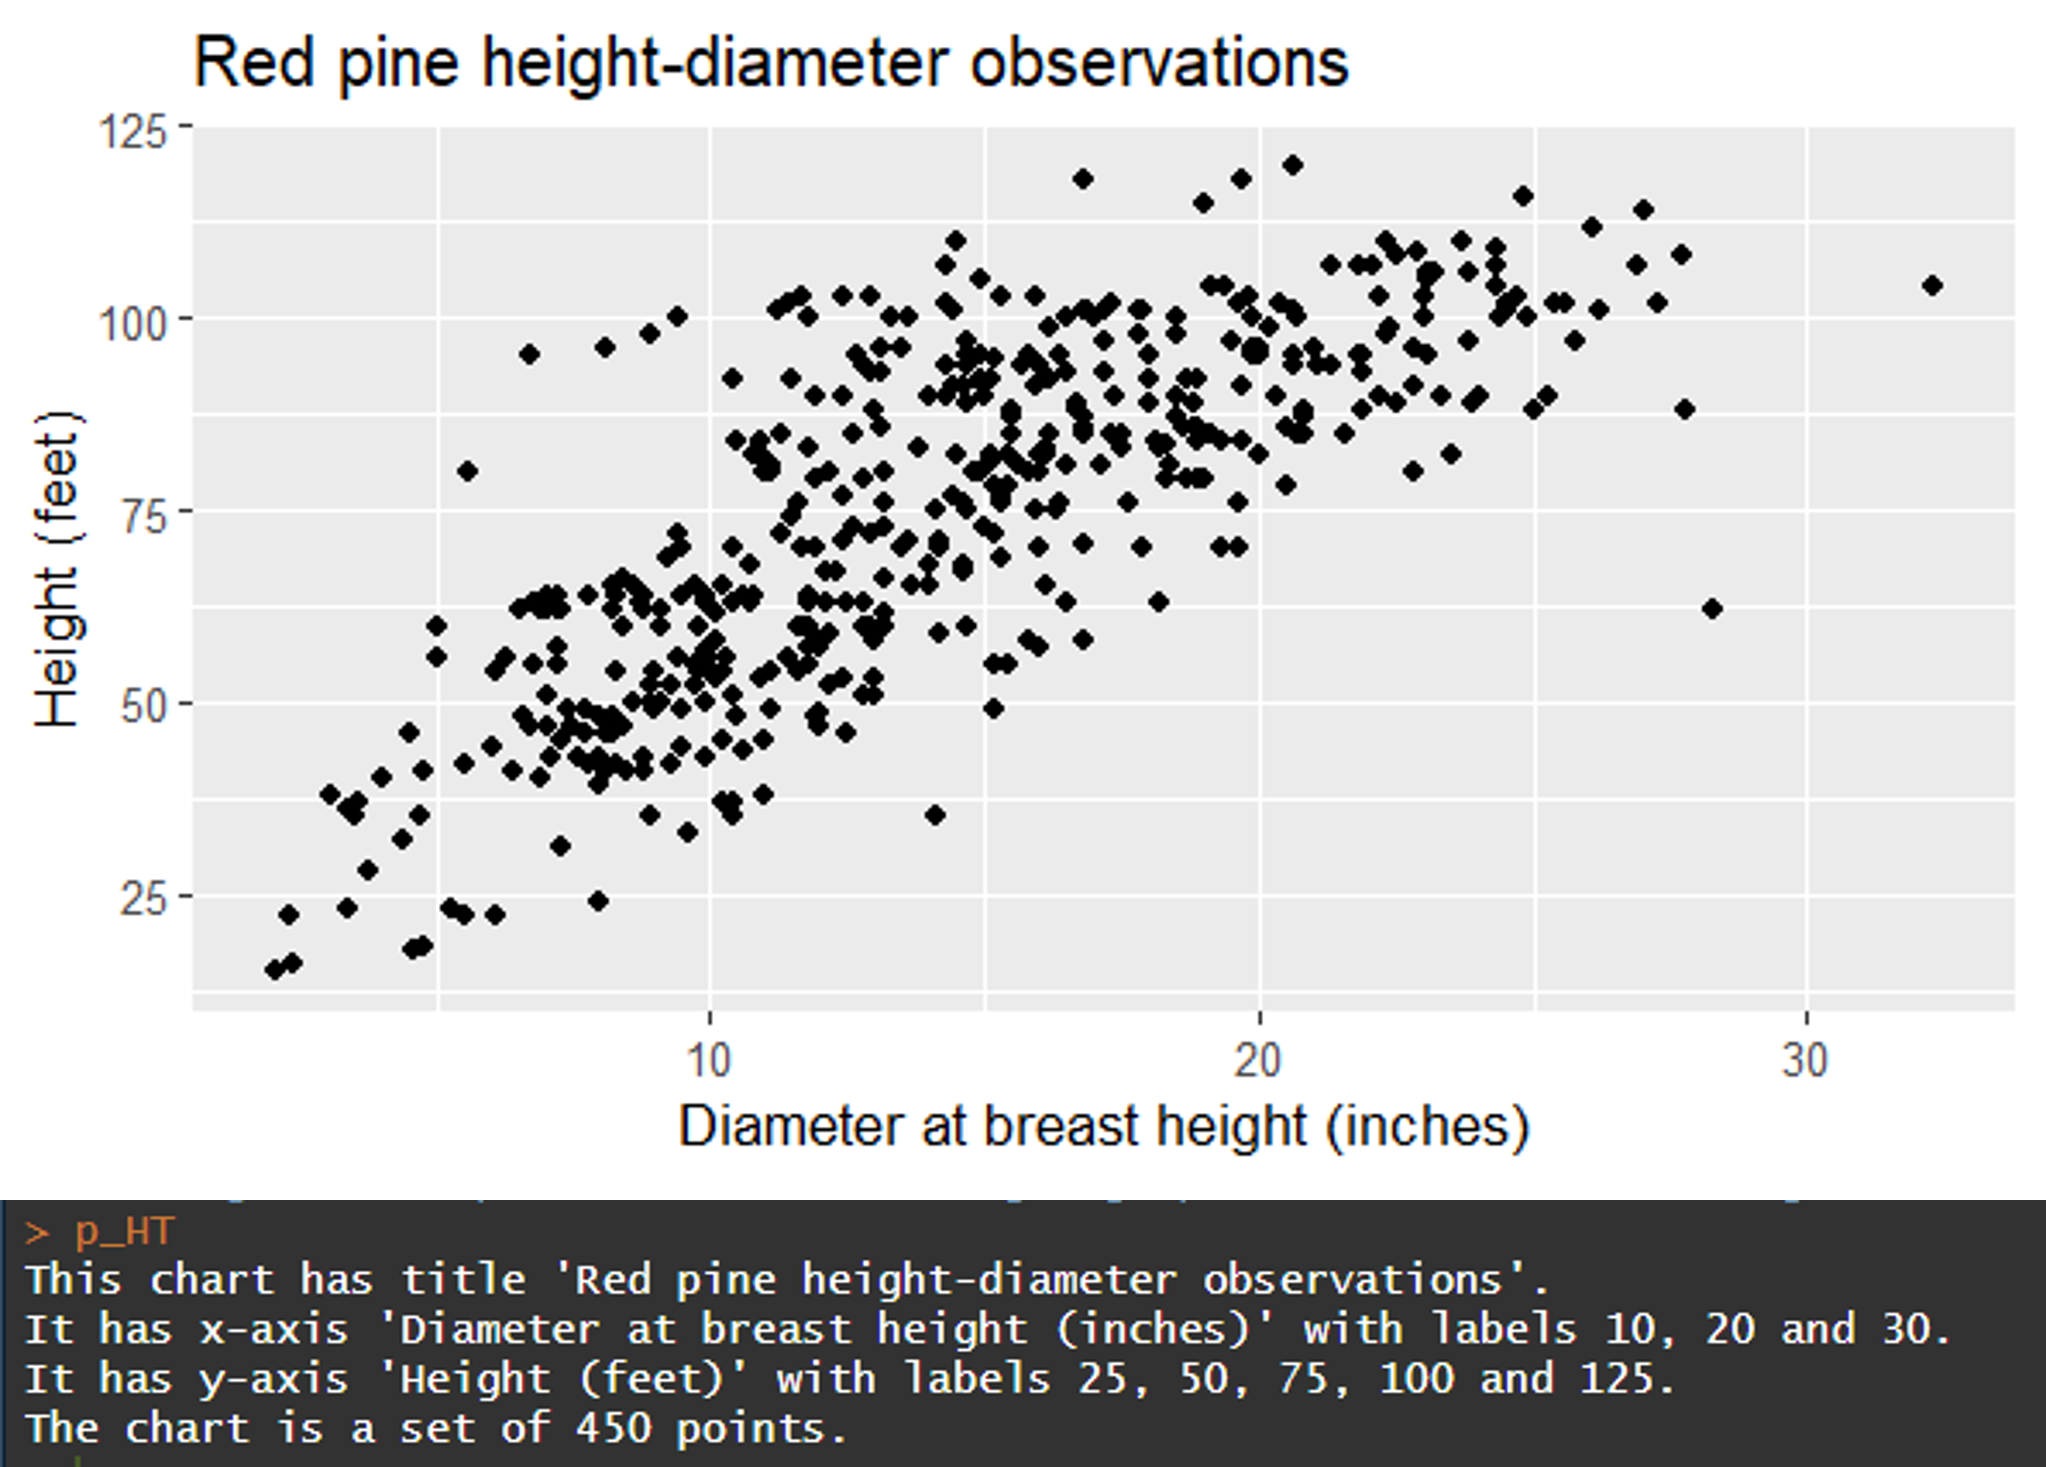
An R package to make graphs and figures more accessible
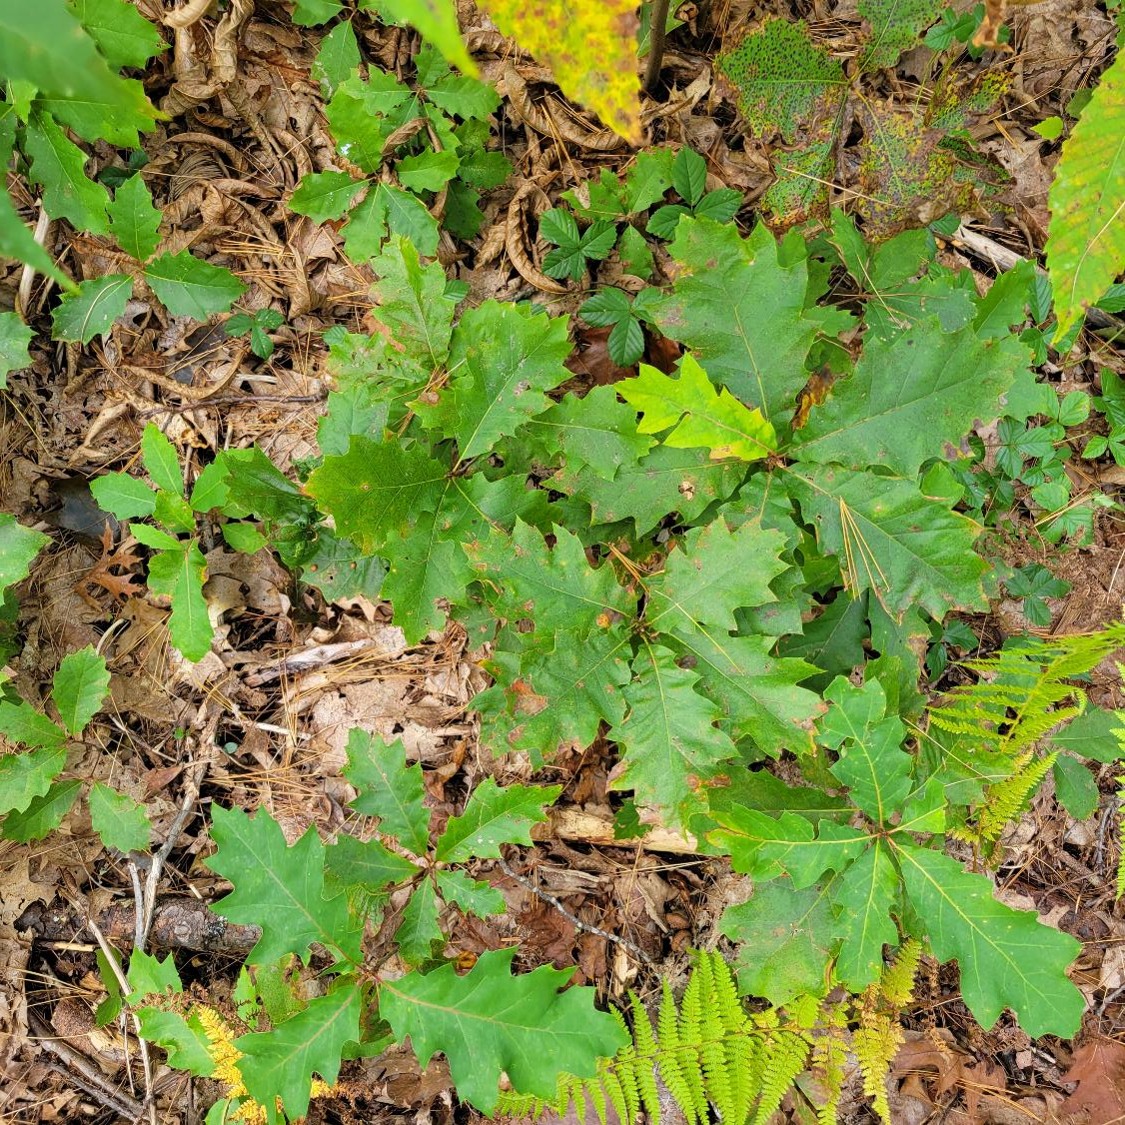
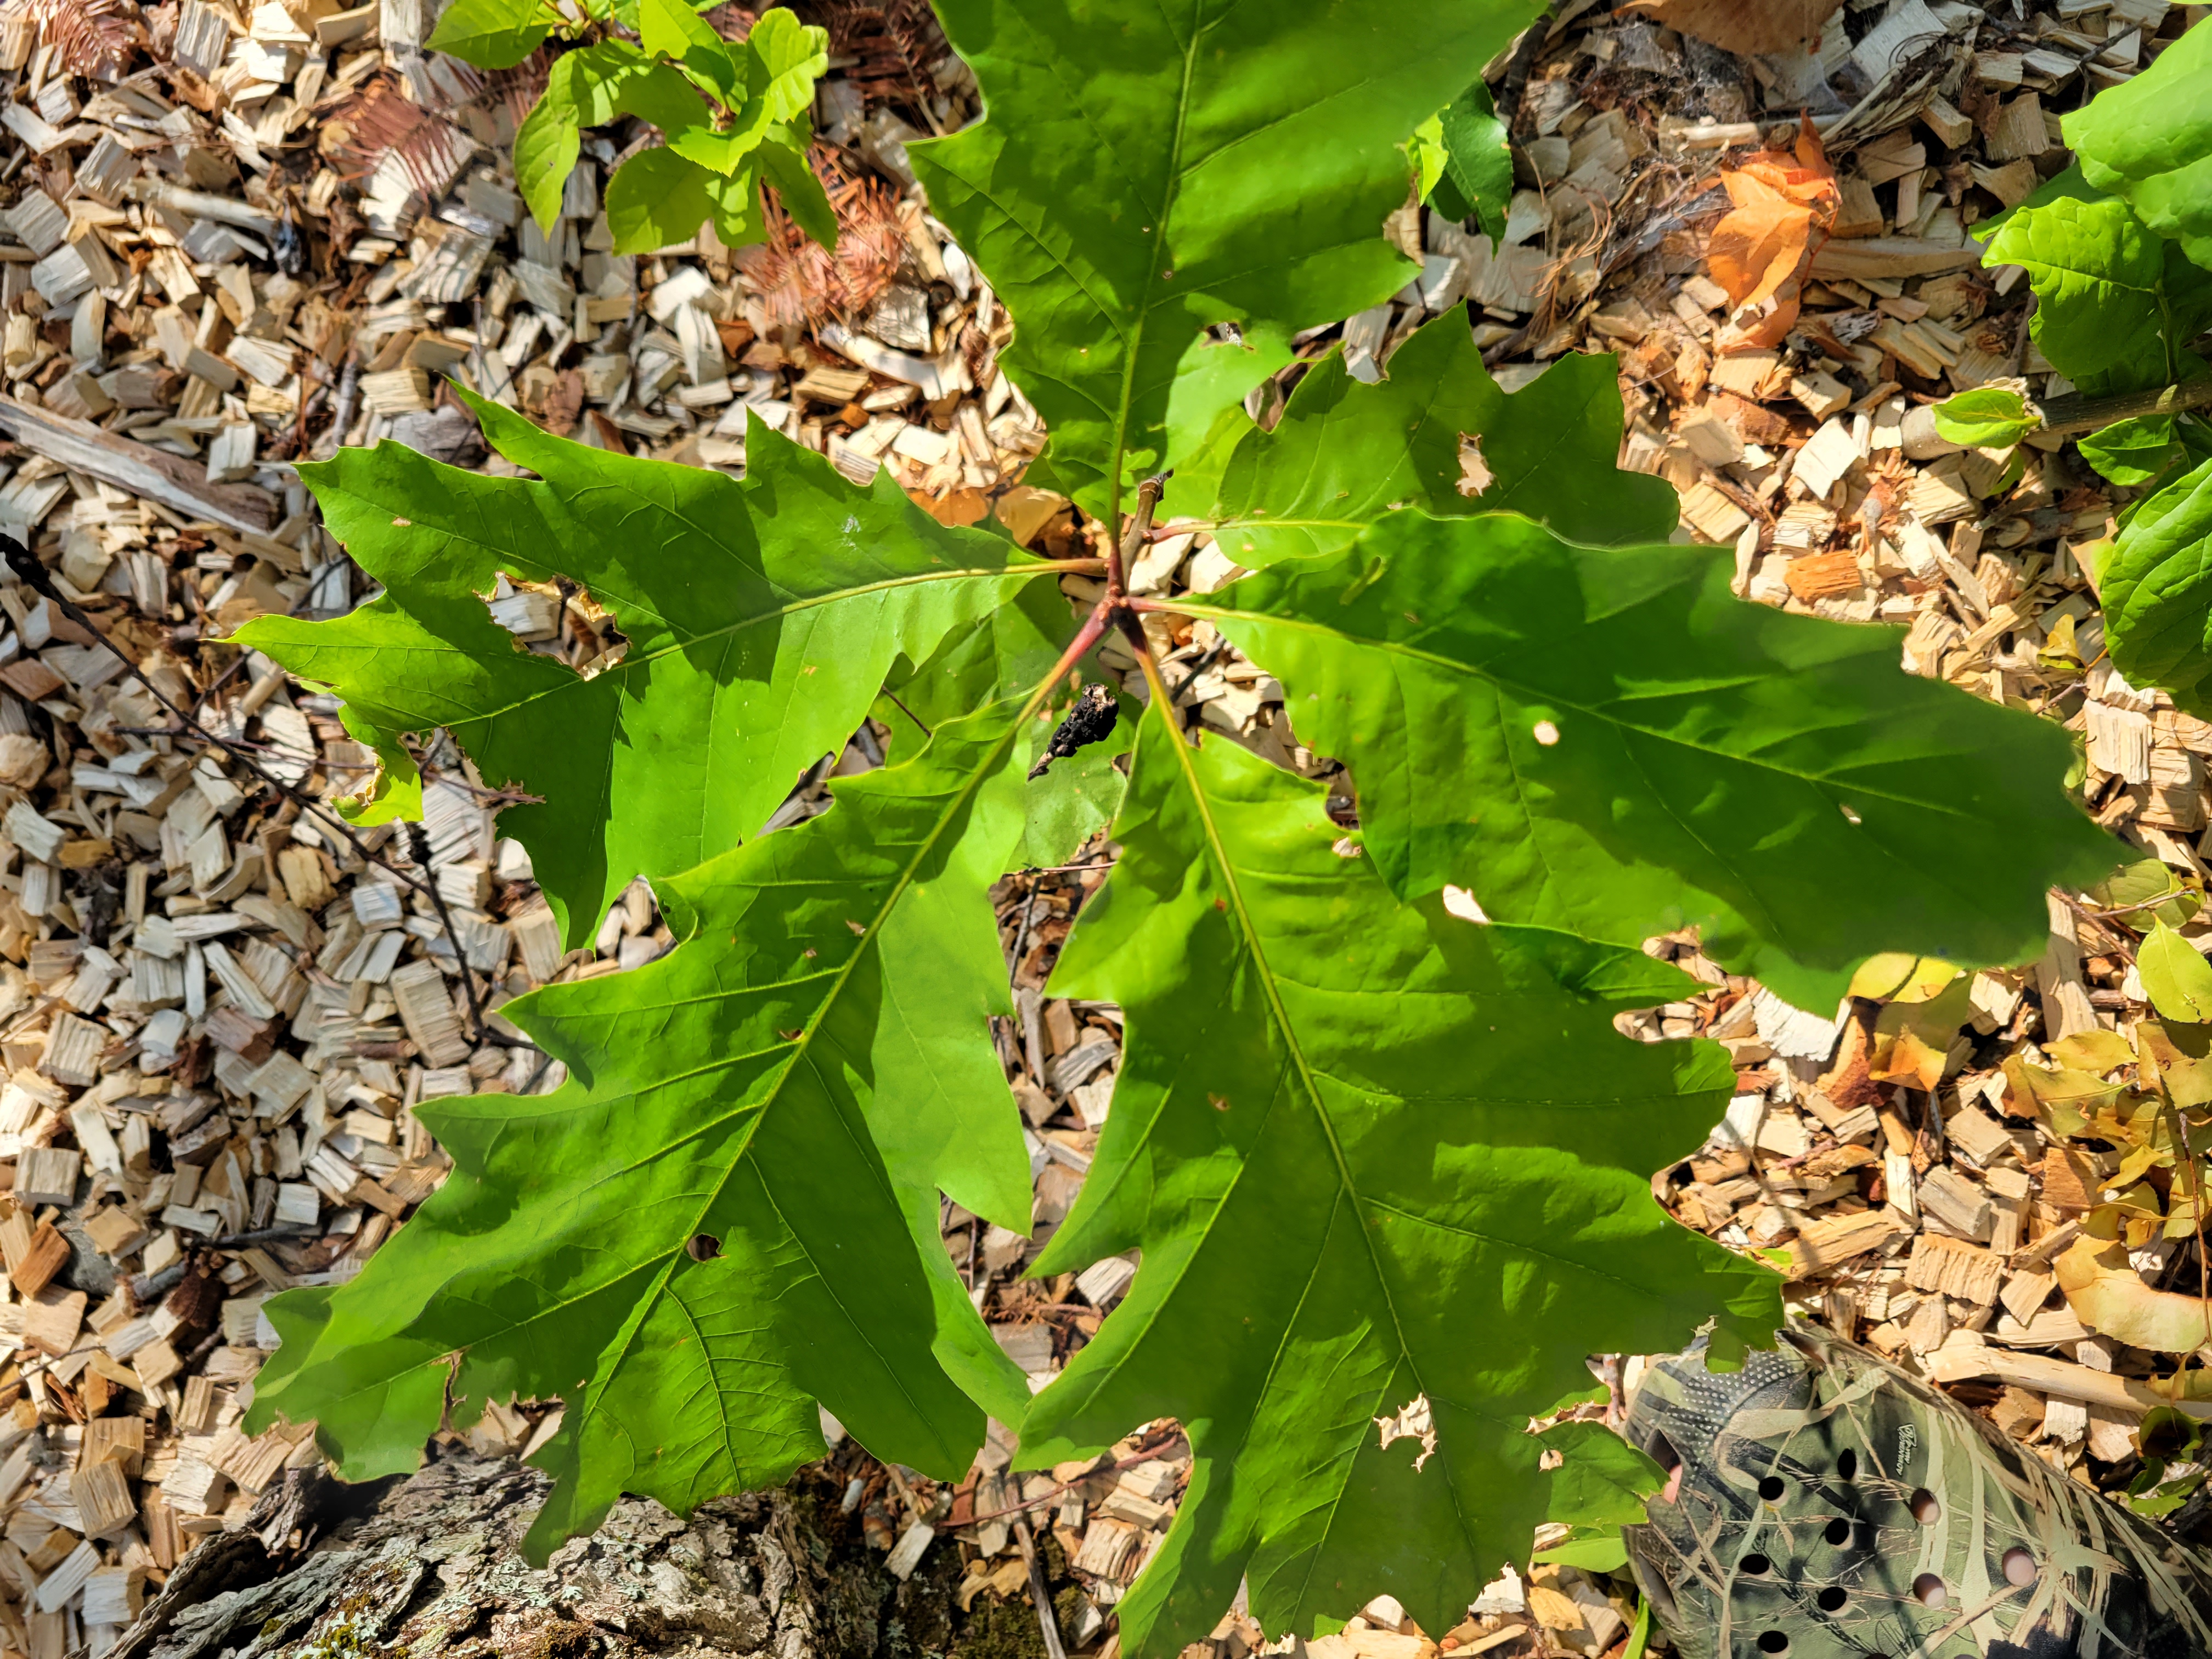
A look at the shade tolerance of tree species in the northeastern US that are projected to see changes in suitable habitat.
Lorey’s height is a measure of average stand height that is weighted by basal area.
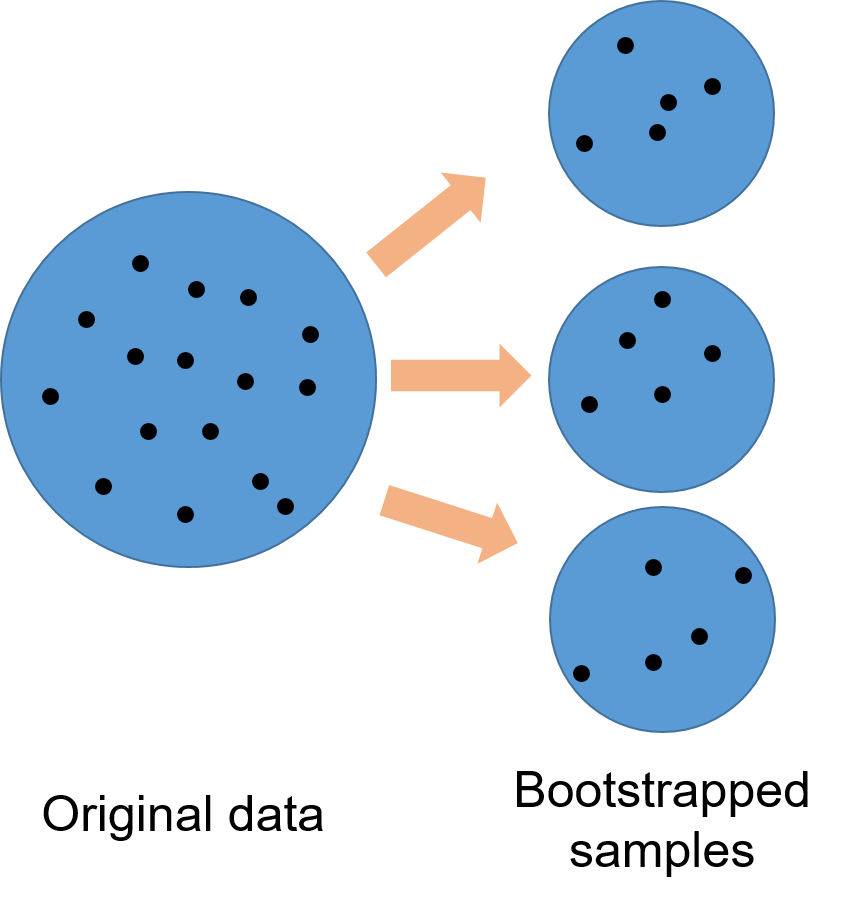
Bootstrapping works well with messy data and with small samples.