
Understanding how forests change is an essential part of determining the amount of carbon that can be stored and sequestered by forests. In particular, different components of forest growth such as mortality and ingrowth need to be quantified to calculate accurate rates of carbon sequestration and net flux.
To measure growth, we need to conduct a forest inventory in at least two time periods. On forest plots that are permanently monumented, the remeasurement cycles vary, but typically range from two years to up to 10 years. There are four primary components of growth:
- Survivor trees: Trees that are alive at the first and second measurement.
- Mortality trees: Trees that are alive at the first measurement but found to have died at the second measurement.
- Harvested trees: Trees that are alive at the first measurement but were cut prior to the second measurement.
- Ingrowth trees: Trees that were too small to be sampled in the first measurement but were large enough at the sample measurement to be included.
A classic publication on forest growth was written by Thomas Beers in 1962 and focused on tree volume. This post follows the components of growth outlined in that publication, but instead focuses on forest carbon.
Components of forest growth
Gross growth measures the total growth of an attribute (e.g., stand volume, biomass, or carbon) over a specified growth period. From a carbon perspective, it includes the sum of carbon stored in live trees at time 2 (\(Carbon_2\)), mortality trees (\(Mort\)), and harvested trees (\(Harv\)) minus the amount of carbon stored in live trees at time 1 (\(Carbon_1\)):
\[\mbox{Gross growth} = Carbon_2 + Mort + Harv - Carbon_1\] Net growth represents the growth of an attribute over a specified growth period after deducting mortality:
\[\mbox{Net growth} = Carbon_2 + Harv - Carbon_1\] One can also deduct the amount of carbon in harvested trees to actual change in live tree growing stocks, termed the net increase: \[\mbox{Net increase} = Carbon_2 - Carbon_1\]
Following these different components of forest growth can help us understand the growth and production of forest carbon.
Data on forest carbon growth
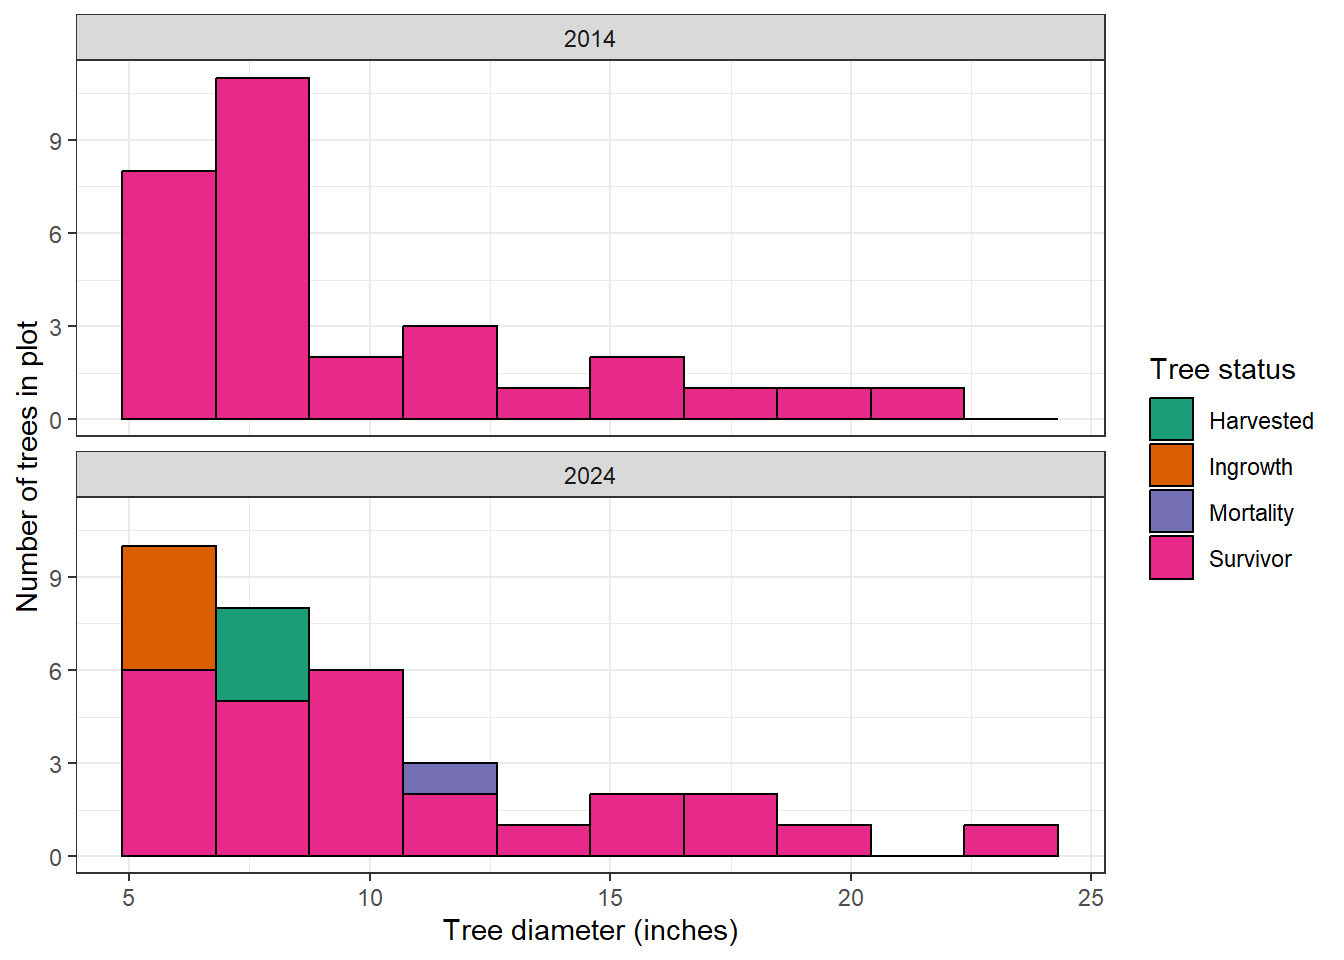
To use an example, consider some forest inventory data were compiled from a permanent forest plot in western Maine, USA. The plot was measured in 2014 and then was measured again in 2024. All trees greater than 5.0 inches in diameter at breast height were measured in each inventory on a plot that totaled approximately 1/6th of an acre in size.
The plot consisted of mostly eastern hemlock (Tsuga canadensis) and northern red oak species (Quercus rubra). In 2014, there were 30 trees measured in the plot. In 2024, four new red oak trees were counted as ingrowth trees, growing above the 5.0-inch minimum threshold. Also during the growth period, three trees were harvested from the lower end of the diameter range and one tried died. Note the slight “right-shifting” of the diameter distribution as survivor trees grew larger over the 10-year growth period:
Using the tree diameter and species, biomass was calculated using common equations and were then converted to carbon as measured in carbon dioxide equivalents. The following table expresses the tree-level changes in the different components of forest growth:
| TreeID | Species | STATUS_2014 | STATUS_2024 | DBH_2014 | DBH_2024 | CO2_kg_2014 | CO2_kg_2024 | Survivor | Mortality | Harvested | Ingrowth | |
|---|---|---|---|---|---|---|---|---|---|---|---|---|
| 1 | TSCA | Survivor | Survivor | 16.4 | 17.3 | 1513.0 | 1728.0 | 215.0 | NA | NA | NA | |
| 2 | TSCA | Survivor | Survivor | 21.6 | 22.6 | 2997.0 | 3353.0 | 356.0 | NA | NA | NA | |
| 3 | TSCA | Survivor | Mortality | 11.7 | 11.7 | 655.0 | NA | NA | -655.0 | NA | NA | |
| 4 | QURU | Survivor | Survivor | 6.6 | 7.3 | 234.0 | 299.0 | 65.0 | NA | NA | NA | |
| 5 | QURU | Survivor | Survivor | 6.6 | 6.6 | 234.0 | 234.0 | 0.0 | NA | NA | NA | |
| 6 | QURU | Survivor | Harvested | 7.4 | 7.4 | 309.0 | NA | NA | NA | -309.0 | NA | |
| 7 | TSCA | Survivor | Survivor | 14.6 | 15.4 | 1134.0 | 1294.0 | 160.0 | NA | NA | NA | |
| 8 | TSCA | Survivor | Survivor | 5.9 | 5.9 | 120.0 | 120.0 | 0.0 | NA | NA | NA | |
| 9 | QURU | Survivor | Survivor | 6.2 | 6.2 | 201.0 | 201.0 | 0.0 | NA | NA | NA | |
| 10 | TSCA | Survivor | Survivor | 8.7 | 9.6 | 314.0 | 401.0 | 87.0 | NA | NA | NA | |
| 11 | TSCA | Survivor | Survivor | 7.5 | 8.4 | 217.0 | 288.0 | 71.0 | NA | NA | NA | |
| 12 | QURU | Survivor | Survivor | 6.6 | 7.2 | 234.0 | 289.0 | 55.0 | NA | NA | NA | |
| 13 | TSCA | Survivor | Survivor | 14.2 | 15 | 1058.0 | 1213.0 | 155.0 | NA | NA | NA | |
| 14 | TSCA | Survivor | Survivor | 16.7 | 17.5 | 1583.0 | 1778.0 | 195.0 | NA | NA | NA | |
| 15 | ACRU | Survivor | Survivor | 5.1 | 5.1 | 125.0 | 125.0 | 0.0 | NA | NA | NA | |
| 16 | QURU | Survivor | Survivor | 8.4 | 9.2 | 421.0 | 526.0 | 105.0 | NA | NA | NA | |
| 17 | QURU | Survivor | Harvested | 7 | 7 | 270.0 | NA | NA | NA | -270.0 | NA | |
| 18 | QURU | Survivor | Survivor | 9.2 | 9.9 | 526.0 | 628.0 | 102.0 | NA | NA | NA | |
| 19 | QURU | Survivor | Harvested | 7 | 7 | 270.0 | NA | NA | NA | -270.0 | NA | |
| 20 | TSCA | Survivor | Survivor | 8.6 | 9.5 | 305.0 | 390.0 | 85.0 | NA | NA | NA | |
| 21 | TSCA | Survivor | Survivor | 10.5 | 11.4 | 500.0 | 614.0 | 114.0 | NA | NA | NA | |
| 22 | TSCA | Survivor | Survivor | 8.7 | 9.7 | 314.0 | 411.0 | 97.0 | NA | NA | NA | |
| 23 | QURU | Survivor | Survivor | 5.7 | 6.5 | 164.0 | 226.0 | 62.0 | NA | NA | NA | |
| 24 | QURU | Survivor | Survivor | 7.6 | 8.2 | 330.0 | 397.0 | 67.0 | NA | NA | NA | |
| 25 | QURU | Survivor | Survivor | 8.6 | 9.5 | 446.0 | 568.0 | 122.0 | NA | NA | NA | |
| 26 | QURU | Survivor | Survivor | 6 | 6.6 | 186.0 | 234.0 | 48.0 | NA | NA | NA | |
| 27 | QURU | Survivor | Survivor | 7 | 7.8 | 270.0 | 352.0 | 82.0 | NA | NA | NA | |
| 28 | TSCA | Survivor | Survivor | 18.6 | 19.6 | 2068.0 | 2355.0 | 287.0 | NA | NA | NA | |
| 29 | TSCA | Survivor | Survivor | 12.6 | 13.4 | 787.0 | 917.0 | 130.0 | NA | NA | NA | |
| 30 | TSCA | Survivor | Survivor | 11.4 | 12.3 | 614.0 | 741.0 | 127.0 | NA | NA | NA | |
| 31 | QURU | NA | Ingrowth | NA | 5.5 | NA | 150.0 | NA | NA | NA | 150.0 | |
| 32 | QURU | NA | Ingrowth | NA | 5.5 | NA | 150.0 | NA | NA | NA | 150.0 | |
| 33 | QURU | NA | Ingrowth | NA | 5.2 | NA | 131.0 | NA | NA | NA | 131.0 | |
| 34 | QURU | NA | Ingrowth | NA | 5.2 | NA | 131.0 | NA | NA | NA | 131.0 | |
| Plot total, kg CO2-eq | 18399.0 | 20244.0 | 2787.0 | -655.0 | -849.0 | 562.0 | ||||||
| Plot total, tonnes CO2-eq/acre | 110.7 | 121.8 | 16.8 | -3.9 | -5.1 | 3.4 |
In the last two rows of the table, we can see the totals for all trees on the plot and then expressed in metric tonnes of CO2 equivalents on a per-acre basis. Using these values, gross growth is calculated as:
\[\mbox{Gross growth} = 121.8 + 3.9 + 5.1 - 110.7 = 20.1 \mbox{ MT CO2-eq/ac}\] and net growth is calculated as:
\[\mbox{Net growth} = 121.8 + 5.1 - 110.7 = 16.2 \mbox{ MT CO2-eq/ac}\]
Calculated on an annual basis, these values represent a gross and net growth of 2.01 and 1.62 tonnes CO2-eq/ac/yr.
From experience, these annual growth rates for carbon are within the range of what I would expect for the forest type and geographic region. See my go-to resources for validating forest carbon numbers for more data sources that provide assurance that forest carbon estimates meet your expectations.
–
By Matt Russell. For more, subscribe to my monthly email newsletter to stay ahead on data and analytics trends in the forest products industry.