Many forest management practices that represent “baseline” scenarios involve timber harvesting. The key concepts that represent these baseline harvests are often how frequently harvests occur (e.g., a harvest every 50 years) and how much timber is typically removed during a harvest (e.g., 15 cords per acre). What is often overlooked in characterizing these harvests is the type of silviculture or forest management practice that is specified.
For example, consider a silvicultural thinning as a forest management prescription. There are several ways in which trees can be removed during the harvest, depending on the distribution of the diameters in a stand:
- Thin from below: Trees are removed from the bottom of the stand’s diameter distribution, i.e., small diameter trees are removed.
- Thin from throughout: Trees are removed from throughout the diameter distribution, i.e., trees of all sizes are removed.
- Thin from above: Trees are removed from the top of the stand’s diameter distribution, i.e., large diameter trees are removed.
The choice of which thinning method to use will depend on the forest type, stand conditions, and management objectives. What is important to note is that the subsequent growth of residual trees in the stand will be different for these three thinning techniques. If only large diameter trees remain after a thinning (i.e., if a thinning from below occurred), the stand will develop differently compared to a stand with small residual trees (i.e., if a thinning from above occurred).
This post describes the impacts of thinning type on the forest carbon development for up to 40 years after the thinning, using a case study of stands in western Maine.
Simulating thinning treatments
Data were compiled from the Forest Inventory and Analysis (FIA) database from Oxford County in western Maine. There were three stands that were simulated:
- Stand #1 had an initial basal area in 2025 of 140 sq. ft/ac. Eastern hemlock and northern red oak were the dominant species.
- Stand #2 had an initial basal area in 2025 of 188 sq. ft/ac. Red spruce and to a lesser extent paper birch were the dominant species.
- Stand #3 had an initial basal area in 2025 of 140 sq. ft/ac. Yellow birch and sugar maple were the dominant species.
The Northeast variant of the Forest Vegetation Simulator was used to simulate the forest composition in these stands for 50 years. Each stand was thinned to a residual basal area of 80 sq. ft/ac in 2035. In addition, the method of thinning was altered to a thin from below, thin throughout, and thin from above.
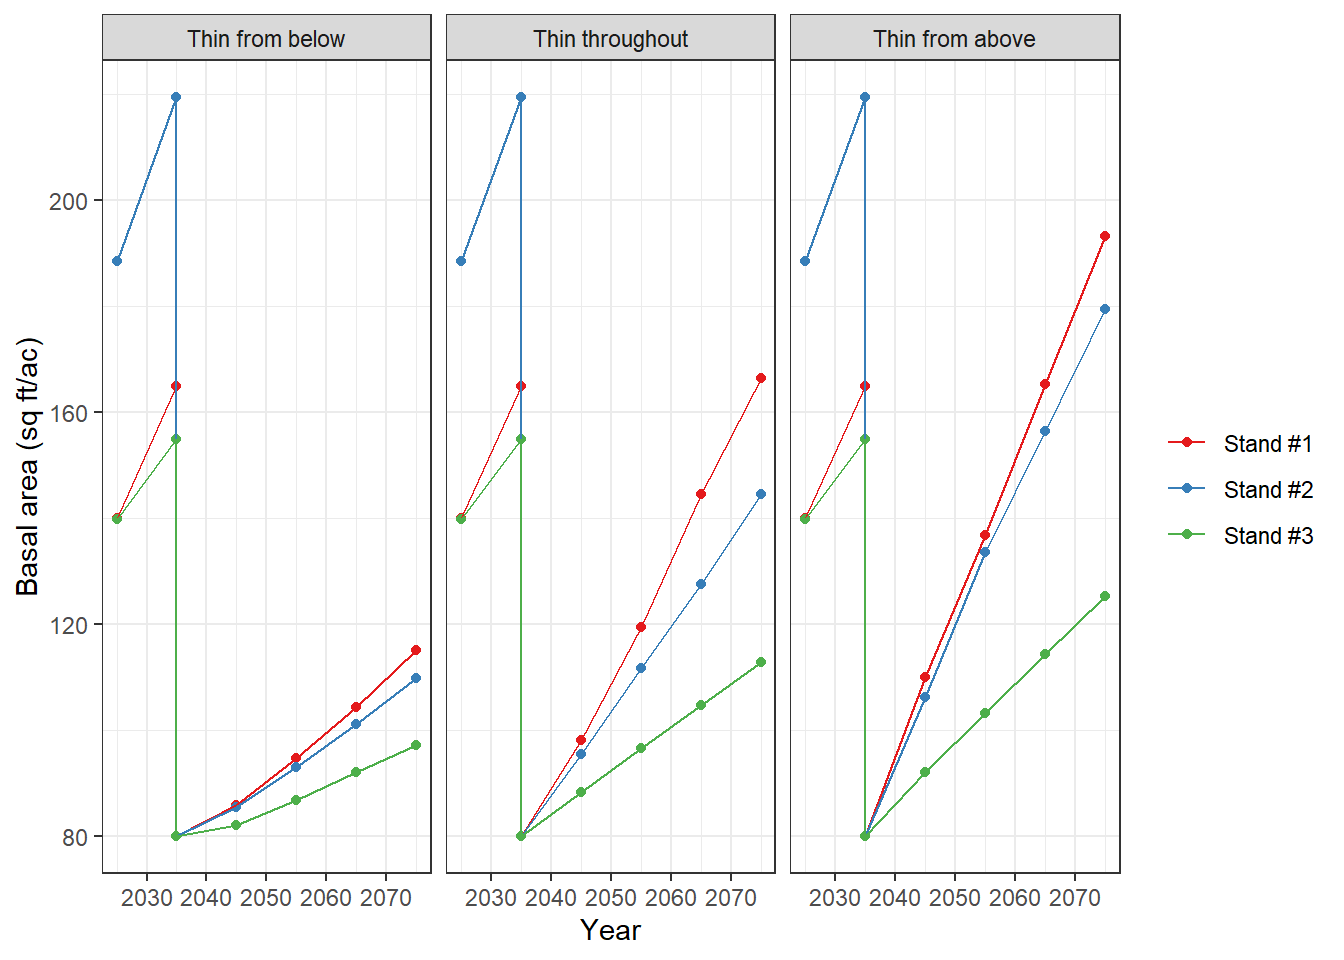
Below you can see the 50-year trends in basal area development in each scenario and stand. Note that while each stand is thinned to the same basal area in 2035, each stand develops differently depending on species composition, stand conditions, and site index.
A great way to visualize what’s happening during the thinnings is to look at the diameter distributions of the harvested trees. The graph below shows the number of harvested trees in each stand and diameter class.
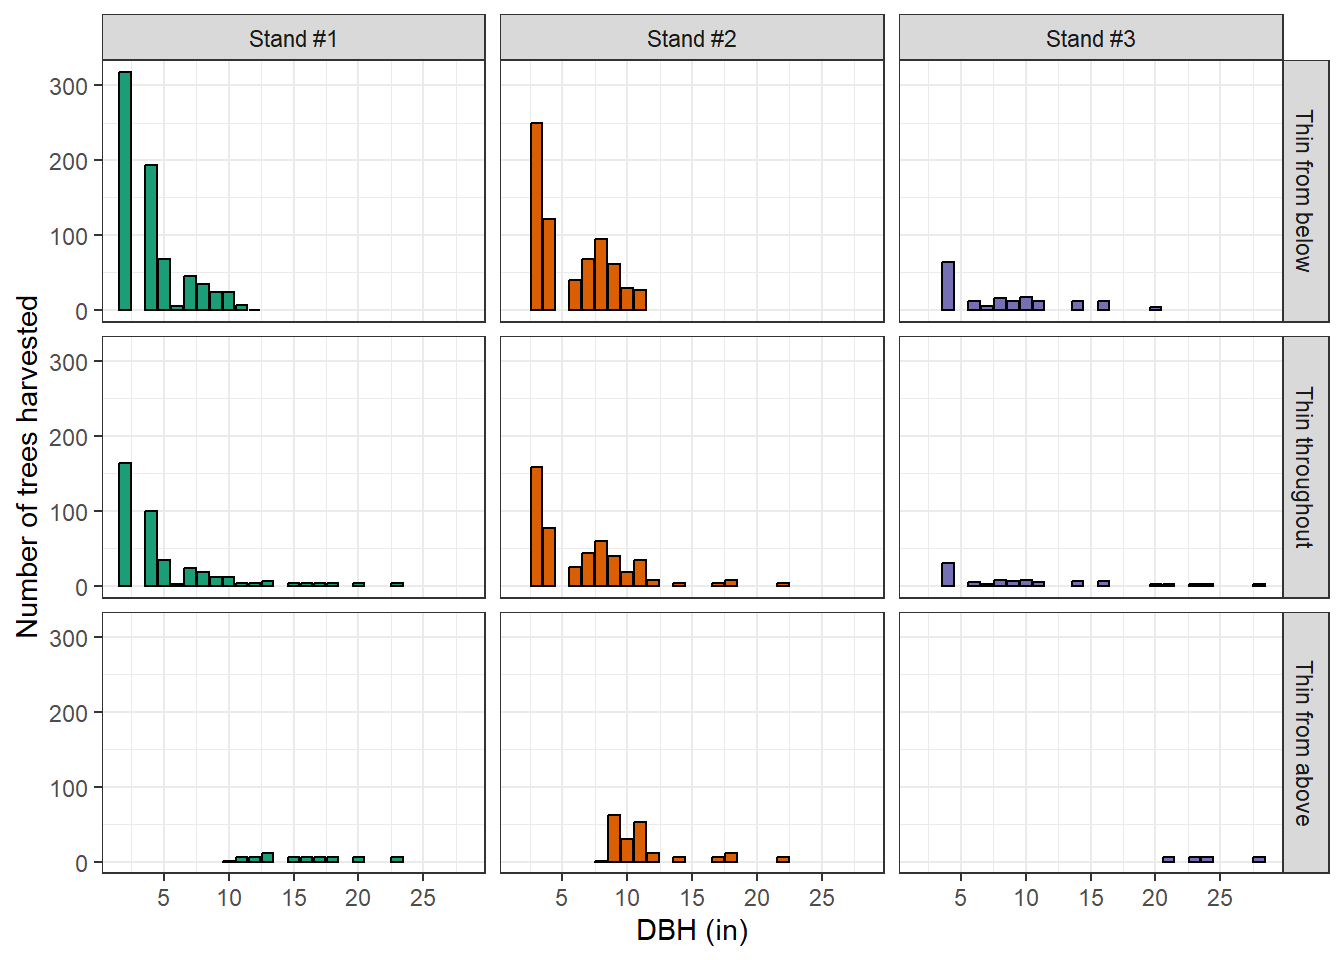
Note that the thinning from below removes only the smallest trees, the thinning from above removes only the larger trees, and the thin throughout removes trees of all sizes. Furthermore, the thinning from below needs to remove many more trees than the thinning from above scenario to reach the 80 sq ft thinning target. For example, 716 trees per acre are removed in the thinning from below scenario in Stand #1, compared to only 60 trees per acre in Stand #2.
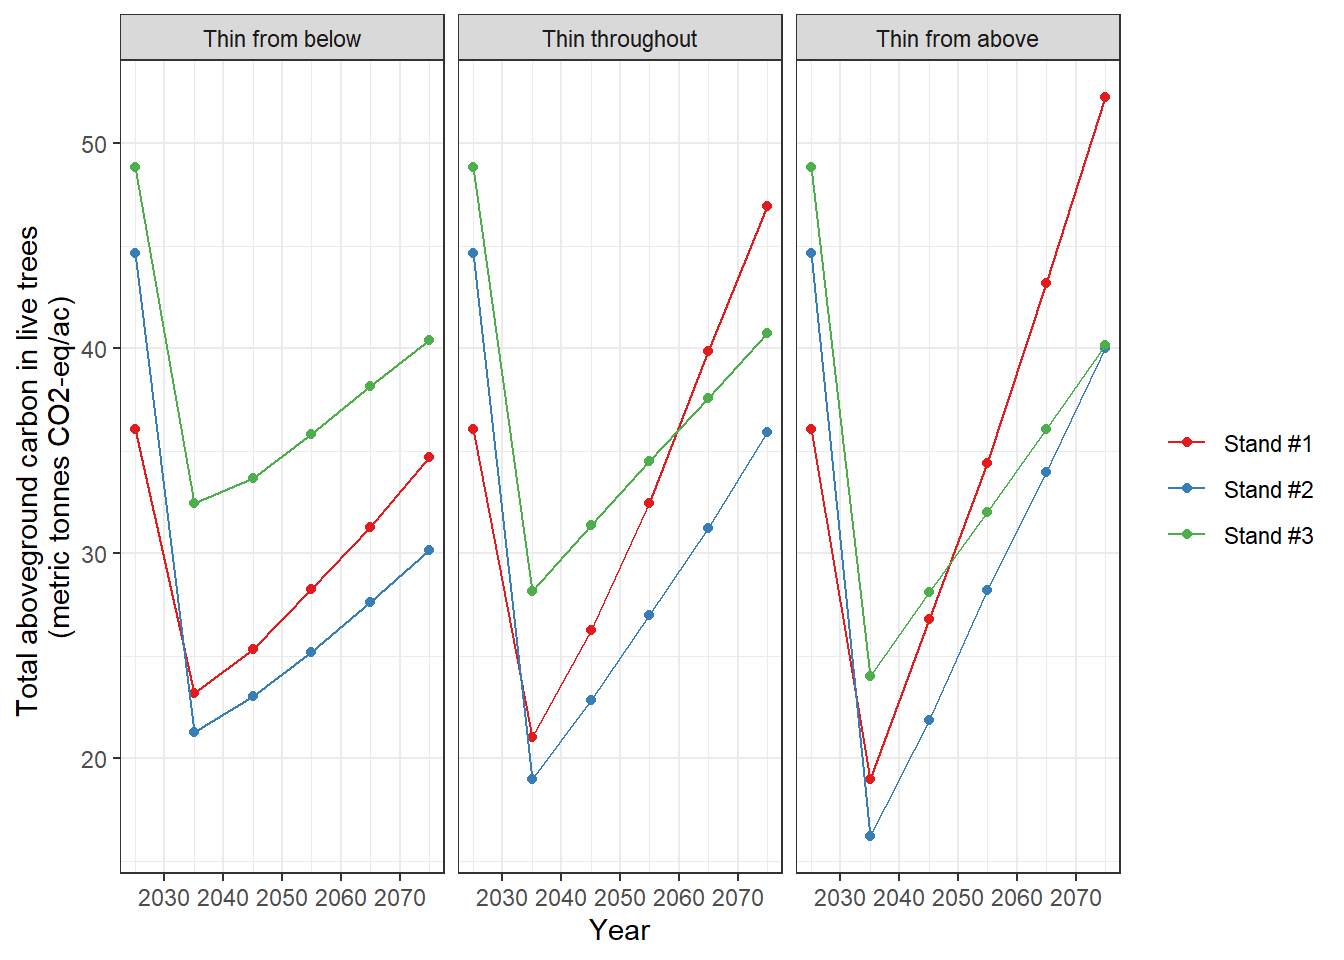
The amount of carbon stored in each stand also varies after thinning, showing that the type of thinning treatment matters when quantifying forest carbon. In these examples, Stand #1 has the greatest amount of carbon after 50 years for thin from above treatment, while Stand #3 stores the most carbon after 50 years if conducting a thin from below treatment.
In these examples, thinning throughout and thinning from above promote greater carbon storage in Stands #1 and #2. In Stand #1, the difference between the thinning from below and thinning from above treatment after 50 years is nearly 17 tonnes/ac. In Stand #3, all thinning treatments predict a similar amount of aboveground carbon after 50 years:
It should be noted that these trends rely on most of the default settings in the FVS model. More advanced work to “dial-in” FVS projections could calibrate tree growth following thinning, add natural regeneration during the simulation, or modify the default mortality rates used in the projections.
As this post shows, the details about which trees are removed during a harvest can lead to divergent forest carbon outcomes. The choice of which thinning treatment to specify is likely to have a larger influence in mixed-species stands with uneven-aged stand structures. This is because diameter distributions in these stands will be wider compared to single-species, even-aged stands.
–
Want to read more?: Our recent article Characterizing timber harvest occurrence and intensity to inform forest carbon management across the eastern United States analyzes timber harvest characteristics. Common thinning treatments (e.g., from below, above, or throughout) are labeled for each forest type group for a broad assessment of thinning strategies common in eastern US forests.
By Matt Russell. Email Matt with any questions or comments.