| State | Annual net growth, mtCO2-e/ac/yr | Annual net growth, cords/ac/yr | CO2-e: cords ratio |
|---|---|---|---|
| 1 Alabama | 3.90 | 1.25 | 0.32 |
| 5 Arkansas | 3.12 | 0.97 | 0.31 |
| 9 Connecticut | 1.38 | 0.45 | 0.33 |
| 10 Delaware | 2.66 | 0.79 | 0.30 |
| 12 Florida | 1.62 | 0.49 | 0.30 |
| 13 Georgia | 3.30 | 1.06 | 0.32 |
| 17 Illinois | 1.70 | 0.45 | 0.26 |
| 18 Indiana | 2.69 | 0.80 | 0.30 |
| 19 Iowa | 1.43 | 0.35 | 0.24 |
| 21 Kentucky | 2.44 | 0.70 | 0.29 |
| 22 Louisiana | 2.93 | 0.98 | 0.33 |
| 23 Maine | 1.57 | 0.49 | 0.31 |
| 24 Maryland | 2.41 | 0.70 | 0.29 |
| 25 Massachusetts | 1.59 | 0.57 | 0.36 |
| 26 Michigan | 1.62 | 0.53 | 0.33 |
| 27 Minnesota | 1.32 | 0.44 | 0.33 |
| 28 Mississippi | 4.46 | 1.45 | 0.33 |
| 29 Missouri | 1.68 | 0.44 | 0.26 |
| 33 New Hampshire | 1.98 | 0.62 | 0.31 |
| 34 New Jersey | 1.19 | 0.29 | 0.24 |
| 36 New York | 2.07 | 0.63 | 0.30 |
| 37 North Carolina | 3.18 | 1.04 | 0.33 |
| 39 Ohio | 2.09 | 0.55 | 0.26 |
| 40 Oklahoma | 1.46 | 0.41 | 0.28 |
| 42 Pennsylvania | 1.69 | 0.44 | 0.26 |
| 44 Rhode Island | 0.30 | 0.20 | 0.67 |
| 45 South Carolina | 3.63 | 1.20 | 0.33 |
| 47 Tennessee | 2.76 | 0.83 | 0.30 |
| 48 Texas | 1.18 | 0.30 | 0.25 |
| 50 Vermont | 1.86 | 0.56 | 0.30 |
| 51 Virginia | 3.14 | 0.99 | 0.32 |
| 54 West Virginia | 2.56 | 0.71 | 0.28 |
| 55 Wisconsin | 1.84 | 0.59 | 0.32 |
Analysts that work with forest carbon data have a number of standards and units to use in their toolkit. For example, tree biomass is typically expressed in pounds or kilograms, but on an area basis, biomass is typically scaled up to represent tons (e.g., either short or metric tons; green or dry).
From tree biomass, values are converted to carbon, which is approximately half of biomass, but depends on species. Data are often expressed in terms of carbon dioxide equivalents, where 1 unit of carbon is 44/12 = 3.664 units of CO2 equivalents. Most forest carbon researchers express carbon in their original units (e.g., in metric tons of carbon) whereas most applications of forest carbon, principally in carbon projects and markets, express carbon in CO2-equivalents (e.g., metric tons [mt] of CO2-e).
It is interesting that one of the most common units of measure used in forest carbon markets is one that blends metric and English units. Typically, analyses that support carbon projects in the US report values in metric tons of CO2-e on a per acre basis. For example, a forest stand may store 100 mtCO2-e/acre in the live tree pool.
It’s important to have a handle on what carbon values are typical for the forest and stand conditions you work in. Knowing these values can also help to keep your carbon literacy up to date. This knowledge can assist you in having productive conversations with colleagues and communicate data more effectively.
I’ve often found it helpful to have general conversion rates stored in my head that help to convert different units of measure. For example, when I was a graduate student I began reading more papers written by international authors. Units like basal area in square meters per hectare were hard to grasp initially, and they differed from the square feet per acre units I was accustomed to from my US forestry education. But, I soon learned that basal area in meters-squared per hectare is about one-quarter of basal area in square feet per acre. The actual value is 22.96%, but it’s a good enough approximation in my head that works to interpret the data quickly.
In my work life, I often straddle between two teams. The first is the world of forest productivity where terms like basal area, cords, and cubic feet are familiar to me. The second is the world of natural climate solutions and forest carbon, where terms like CO2-e metric tons are common. Being educated in forestry programs for all of my degrees (Go Bobcats, Hokies, and Black Bears!), I continue to think of aspects like forest growth in terms of values like cords per acre per year.
For example, here in Maine there’s a common standard known among foresters that the average growth of timberland is about 0.5 cords per acre per year. Of course it varies by forest type and site conditions, among other factors, but it’s a good rule of thumb. Using this, it’s intuitive that you would need 40 years to grow 20 cords of wood, at which point it would be an appropriate time to conduct an intermediate stand treatment like a thinning.
The “one third rule”
As I’ve analyzed both forest and carbon growth metrics alongside each other, I’ve come to a “one-third rule” for converting between CO2-e and cords. That is, generally about a third of the growth in forest carbon, measured in mtCO2-e/acre, is the growth in cords per acre. For example, the average growth of timberland in Maine is about 1.5 mtCO2-e/acre.
I was curious to see how this plays out with real data, so I queried the USDA Forest Service’s EVALIDator program for all states in the eastern US. I compiled two variables to represent carbon and volume growth, using annual net growth estimates on a per acre basis across all forestland in each state:
- Average annual net growth of aboveground biomass of trees (at least 5 inches d.b.h./d.r.c.), in dry short tons, on forest land (snum = 2635)
- Average annual net growth of sound bole wood volume of trees (timber species at least 5 inches d.b.h.), in cubic feet, on forest land (snum = 574155)
To determine annual net growth in CO2-e, I multiplied to original biomass estimate by 0.5 to obtain carbon, multiplied by 0.9072 to obtain metric tons, then multiplied by 3.664. For the annual net growth in cords, I assumed 85 cubic feet per cord.
Here are the data by state:
And the following shows the annual net growth rate in live aboveground trees by state on the left and the CO2-e: cords ratio on the right:
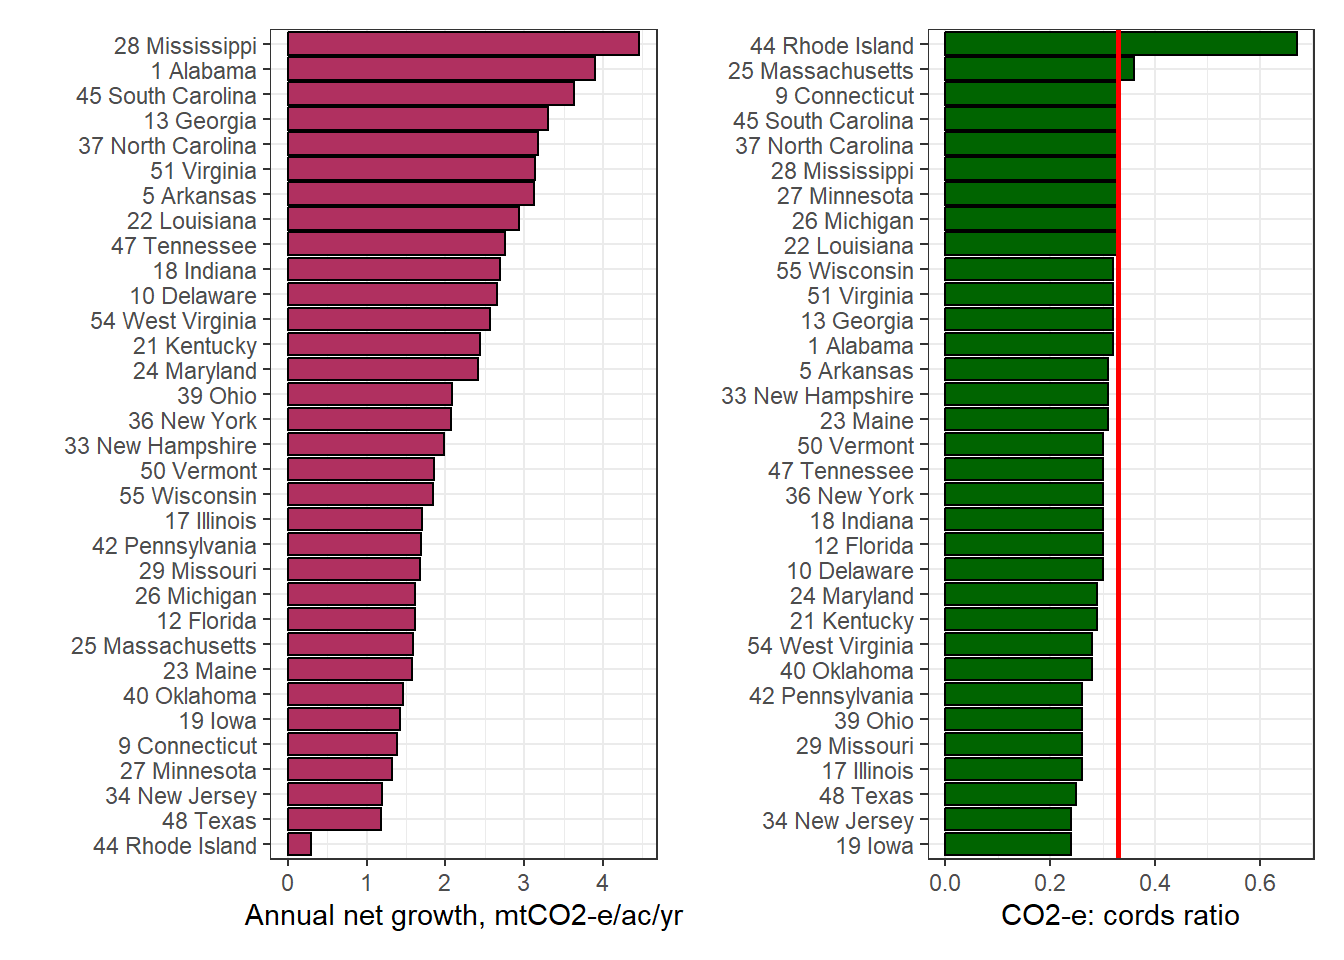
Not surprisingly, there is greater growth in the southern states, with some states exceeding 3.0 mtCO2-e/ac/yr (or 1 cord/ac/yr). The “one-third rule” is fairly consistent across all states (with a mean of 0.3109), with an exception of Rhode Island (which we can possibly attribute to much fewer FIA plots compared to other states).
There could be other factors that affect this general rule. For example, using the FIA query you might choose to calculate the ratio in terms of gross growth, e.g., an estimate that includes mortality. You also might be interested in carbon stored in smaller-diameter trees, or even pools such as standing dead trees.
Having easy conversions like these can help you interpret carbon and forestry data more quickly and efficiently. Which conversions do you use that help to interpret data?
–
By Matt Russell. Sign up for our monthly LinkedIn Newsletter for news, comments, and insights for professionals that work with forests and data