Author Nassim Nicholas Taleb popularized the idea of The Black Swan, most notably in his 2007 book. Taleb defines a Black Swan event as something that:
- is an outlier,
- carries extreme impact, and
- makes humans want to explain it post-hoc, making it explainable and predictable.
Taleb further explains in his book that most of statistics and probability happen in the world of “Mediocristan”. Here, no single observation affects the total. Think of the normal distribution and associated elementary statistical procedures – these are used often to analyze data in Mediocristan.
The alternative world that Taleb describes is “Extremistan”, where the total can be impacted by a single observation. Think of a roomful of 20 average Americans in a room, then a single billionaire walks in. All of a sudden the distribution and average salary in the room skyrockets.
Extreme observations are often the most important ones but are rare. Hence, there is oftentimes limited data on such extreme observations.
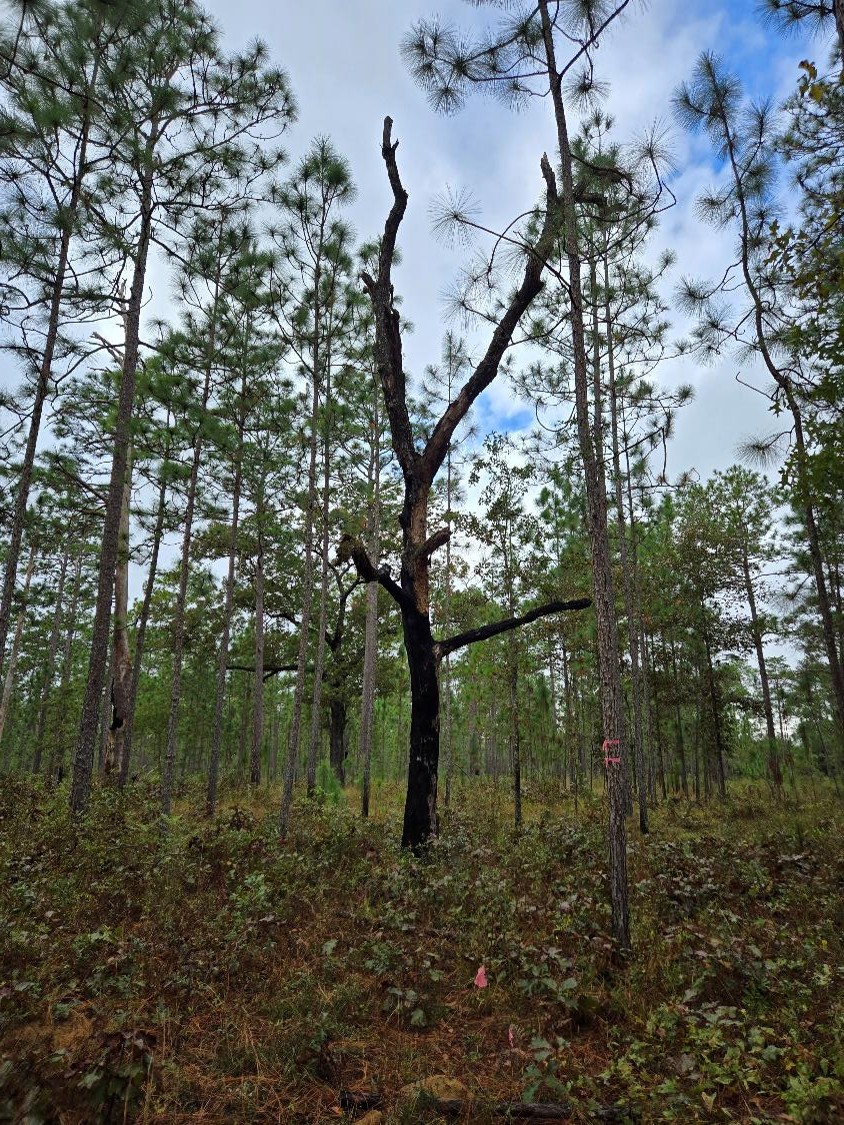
In forestry, mortality is one example. Mortality is already hard enough to predict in a “normal”, healthy forest. Trying to predict the frequency and severity of a catastrophic disturbance like a windstorm or fire is even more difficult. One set of modeling techniques, extreme value analyses, can be used to help understand the impact of rare events with high impact.
Extreme value analysis (EVAs) consider the stochastic behavior of the minimum and maximum values of independent and identically distributed random variables. Specifically, EVAs may help to quantify the distribution of intense events that are rare and/or have a very low probability of occurrence. Hence, EVAs are centered on the analysis of maxima (e.g., upper tails) and/or minima (e.g., lower tails) extremes for sample data.
The cumulative distribution function of a generalized extreme value (GEV) distribution is:
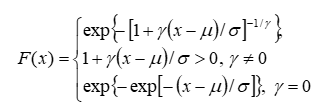
where μ, σ, and γ are termed the location, scale, and shape parameters, respectively. The shape parameter γ takes three possible forms depending on whether it is light-tailed (as indicated by a Gumbel distribution), heavy-tailed (a Fréchet distribution), or bounded (a Weibull). Location and scale parameters are measures of the “centered-ness” and “spread” of the GEV distribution, respectively.
Extreme value analyses are founded on the principle of estimating the probability of events occurring that are more extreme than have been observed. A measure common to such EVAs is the return level, denoted \(z_p\). Hence, \(z_p\) is the level expected to be exceeded on average once every \(1/p\) years, where \(1/p\) is defined as the return period.
For example, in the case of using forest mortality, we might say the “we expect the annual forest mortality related to disturbances from windstorms will exceed 40 tonnes CO2-eq on average every 100 years.” Such return levels may be obtained through examining the parameters of the GEV distribution and specifying the desired return period.
There are several ways to implement EVAs, such as the extRemes package in R. Return periods, e.g., at 5-, 10-, 50, and 100-years, can be estimated to determine how much a quantity can be expected to be exceeded. This is termed a “peaks over threshold” model.
There are several applications of EVAs using forestry data, particularly when evaluating natural disturbances and their impacts. For example, the ability to set a specific return period and quantify its impacts could play a direct role in forest carbon projects. If a property is enrolled in a carbon project over a 40-year crediting period, with the right analysis (and data), one could estimate the impact of large-scale disturbances on forest carbon stocks.
Probably lots of other applications, too.
–
By Matt Russell. Email Matt with any questions or comments.