A few weeks ago I attended Dr. Tony D’Amato’s excellent webinar “Looking at Forest Carbon from Multiple Dimensions”. The content of the webinar was excellent and I encourage anyone involved with forest management and forest carbon to view it.
One primary concept from the webinar stood out to me: many of the future tree species that are anticipated to be well adapted to future conditions are less shade tolerant that current trees on the landscape. Tony described climate-adapted species as being “large gap specialists”, most of which are intermediate or intolerant to shade.
This has tremendous implications for managing forests for carbon and climate. If climate-adapted species require more sunlight, fewer of them can grow in the same amount of area compared to our current more shade tolerant species. Hence, carbon stocks will be lower if we manage forests with climate-adapted species in mind.
I was curious to quantify these differences in shade tolerance in my own region of the northeastern US. A few years ago, the Northern Institute of Applied Climate Science released their report “New England and Northern New York Forest Ecosystem Vulnerability Assessment and Synthesis”. The report contains valuable data on the changes in suitable habitat for tree species using information from the Climate Change Tree Atlas.
The report contains projected changes in potential suitable habitat for 102 tree species in the northeastern US, with forecasts through 2099. (See their Table 10 and Appendix 4). Two model scenarios were implemented: the PCM B1 and GFDL A1FI scenarios. The primary difference is that the GFDL A1FI scenario represented higher greenhouse gas emissions and greater climate warming than the PCM B1 scenario. So, both scenarios can be used to represent two different extremes of a future climate.
For each species, future suitable habitat is labeled for both models as:
- Large decrease,
- Small decrease,
- No change,
- Small increase,
- Large increase, or
- New habitat (species is not currently in the region but is projected to be).
I also acquired species-specific data on shade tolerance values. The data on tolerance values are from a paper I authored in 2014 on plant functional traits (see supplemental data file 1 in the article.) The tolerance values were obtained from the Niinemets and Valladares study published in 2006.
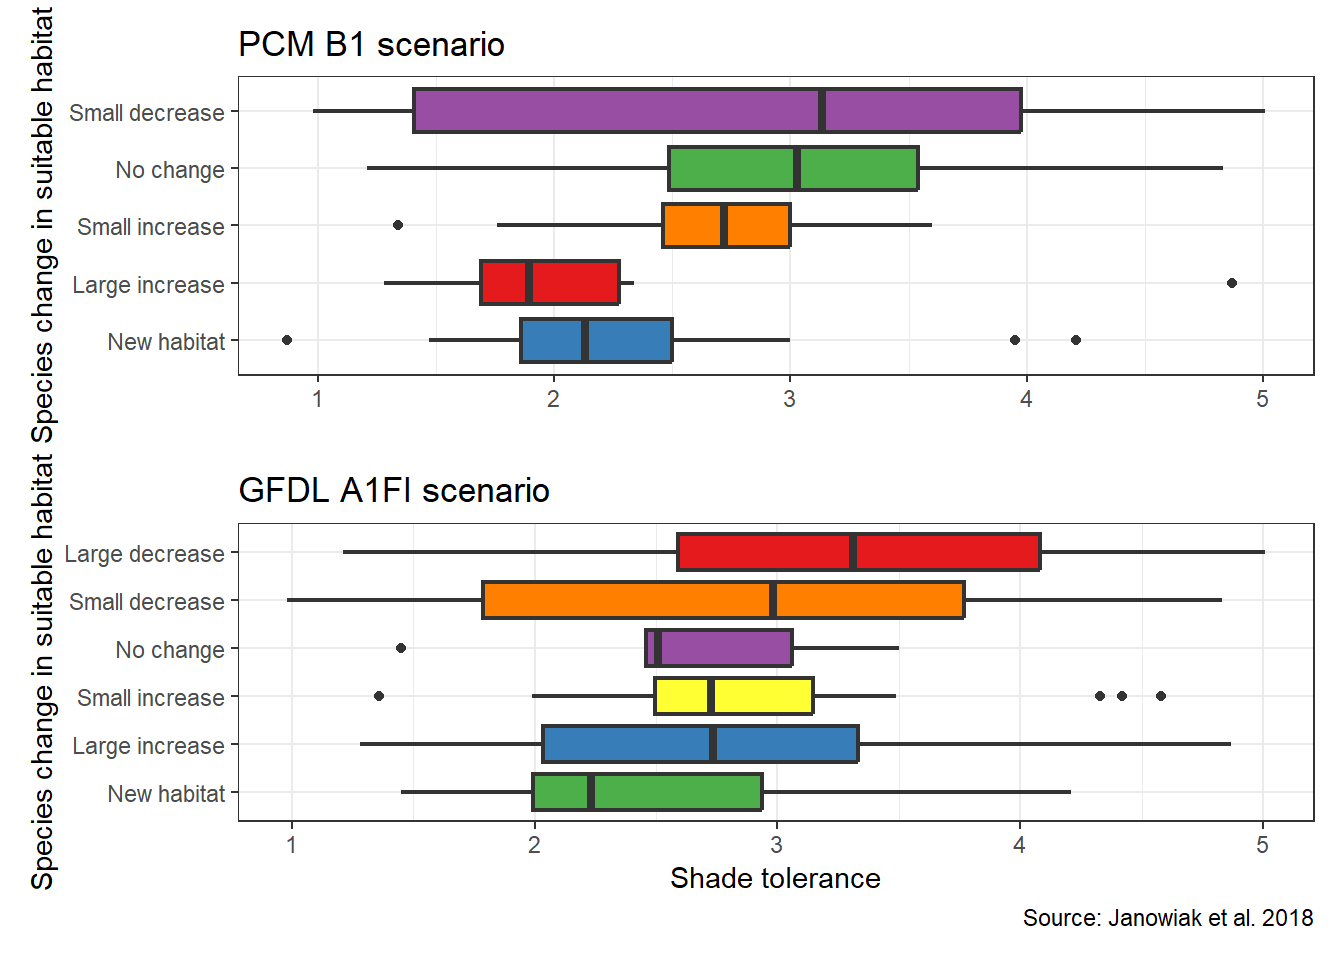
By using boxplots, we can see the general trends in species shade tolerance by classes of future suitable habitat. Indeed, species that are projected to see increases in suitable habitat or are anticipated to see new habitat in the region display lower shade tolerance values relative to species that will see decreases in suitable habitat:
The GFDL A1F1 scenario predicts more species seeing large increases in suitable habitat compared to the PCM B1 model. Generally, the PCM B1 model is more “conservative”, with a greater number of species projected to have no change in suitable habitat through 2099.
Under the PCM B1 scenario, the median shade tolerance for species anticipated to see a large increase in suitable habitat is 1.90, compared to a median value of 3.13 for species projected to see a small decrease. For the GFDL A1F1 scenario, the median shade tolerance for species anticipated to see a large increase is 2.74, compared to a median value of 3.31 for species projected to see a large decrease:
| Scenario | Change | Number of species | Median shade tolerance |
|---|---|---|---|
| GFDL A1F1 | Large decrease | 13 | 3.31 |
| GFDL A1F1 | Large increase | 32 | 2.74 |
| GFDL A1F1 | New habitat | 22 | 2.23 |
| GFDL A1F1 | No change | 5 | 2.51 |
| GFDL A1F1 | Small decrease | 12 | 2.98 |
| GFDL A1F1 | Small increase | 16 | 2.72 |
| PCM B1 | Large increase | 6 | 1.90 |
| PCM B1 | New habitat | 13 | 2.13 |
| PCM B1 | No change | 39 | 3.03 |
| PCM B1 | Small decrease | 10 | 3.13 |
| PCM B1 | Small increase | 21 | 2.72 |
Species that are projected to see decreases in suitable area in the US Northeast include lowland species that are tolerant to flooding, such as black spruce, tamarack, and black ash. Species that are projected to see increases in suitable area include several oaks and shrub species. Several southern pines and oak species are anticipated to have new habitat in the region:
| common_name | ShadeTol | Change |
|---|---|---|
| black spruce | 4.08 | Large decrease |
| black locust | 1.72 | Large increase |
| eastern redcedar | 1.28 | Large increase |
| flowering dogwood | 4.87 | Large increase |
| red mulberry | 2.34 | Large increase |
| sassafras | 1.68 | Large increase |
| yellow-poplar | 2.07 | Large increase |
| bald cypress | 2.13 | New habitat |
| cherrybark oak | 2.24 | New habitat |
| common persimmon | 4.21 | New habitat |
| loblolly pine | 1.99 | New habitat |
| pawpaw | 3.95 | New habitat |
| pond pine | 1.47 | New habitat |
| sand pine | 2.21 | New habitat |
| shortleaf pine | 1.86 | New habitat |
| southern red oak | 2.50 | New habitat |
| sweetgum | 1.59 | New habitat |
| Virginia pine | 1.99 | New habitat |
| American chestnut | 3.06 | No change |
| Atlantic white-cedar | 3.50 | No change |
| scrub oak | 2.51 | No change |
| black ash | 2.96 | Small decrease |
| tamarack | 0.98 | Small decrease |
| eastern redbud | 3.00 | Small increase |
| northern red oak | 2.75 | Small increase |
| Ohio buckeye | 3.49 | Small increase |
| post oak | 2.16 | Small increase |
| sourwood | 2.70 | Small increase |
| sweet birch | 2.58 | Small increase |
Being aware of the light requirements for species can provide insights into expectations for meeting management goals related to forest carbon stocks and sequestration. A naive carbon management strategy might be to plant as many trees as possible, but the shade tolerance of species should be considered when evaluating the tradeoffs between carbon stocking and species requirements.
–
By Matt Russell. If you’re interested in the data and code behind this analysis, see this GitHub page. Email Matt with any questions or comments.