If you follow the latest research in forestry, it’s hard not to come across studies relating to adaptive silviculture. In a nutshell, adaptive silviculture is “designed to specifically address climate change impacts and vulnerabilities to meet management goals and objectives.”
If you’ve ever been on a field tour of a forest that has recently seen a timber harvest and has undergone an adaptive silviculture treatment, you were likely impressed with the complex spatial distribution of residual trees following the harvest. These treatments create gaps between a quarter acre and a few acres in size, leave behind reserve areas where no trees are harvested, or incorporate thinning prescriptions in the “matrix”. All in a single stand, the spatial diversity of these stands can be incredible.
Stands that are managed for climate change can look complex, and so can quantifying their future structure. Most of our growth and yield models were designed to handle relatively simple forest management scenarios such as clearcuts, thinnings, and shelterwood treatments. Simulating stands that are managed under an adaptive silviculture framework can be accomplished with some growth and yield models, but not without careful tinkering.
This post will step through a tutorial using the Forest Vegetation Simulator (FVS), a widely used individual tree model that uses lists of trees (e.g., species and tree diameter) to forecast forest growth through time. The FVS model can simulate forest management activities, disturbances, and provide forest carbon and harvested wood products reports. A series of 22 different model variants provide regional differences in forest growth patterns. This analysis will simulate stands under an adaptive silviculture for climate change approach.
Connecticut FIA data
For this analysis I’ll use three forest inventory plots measured in the state of Connecticut, obtained from the US Forest Inventory an Analysis network of plots. These plots were measured between 2018 and 2021 using a fixed radius sample design. These plots were dominated by oak trees. Two of the plots were recorded as occurring in the white oak/red oak/hickory forest type and the other in the white oak forest type.
Before harvests, initial basal area ranged between 155 and 194 square feet per acre. You can download the FVS-ready files I’ve compiled for these stands at this page on GitHub.
Adaptive silviculture treatments
For the treatments to specify in FVS, we’ll follow a similar prescription that is being conducted at an Adaptive Silviculture for Climate Change experiment in New Hampshire. This treatment follows a resilience approach to climate change, where the treatment will allow some change in current forest conditions, but will also encourage its return to original conditions. The silvicultural strategy is to generally use group and single-tree selection across the stand. The subtreatments within the stand are:
- Gaps: Small gaps that leave openings for light-dependent species (20% of stand),
- Reserves: No management within small areas across the stand (20% of stand), and
- Matrix: Thinning to 80 square feet per acre (60% of the stand)
This approach seeks to maintain the diversity of native tree species while also increasing drought-adapted species like oaks.
Simulating adaptive silviculture with FVS
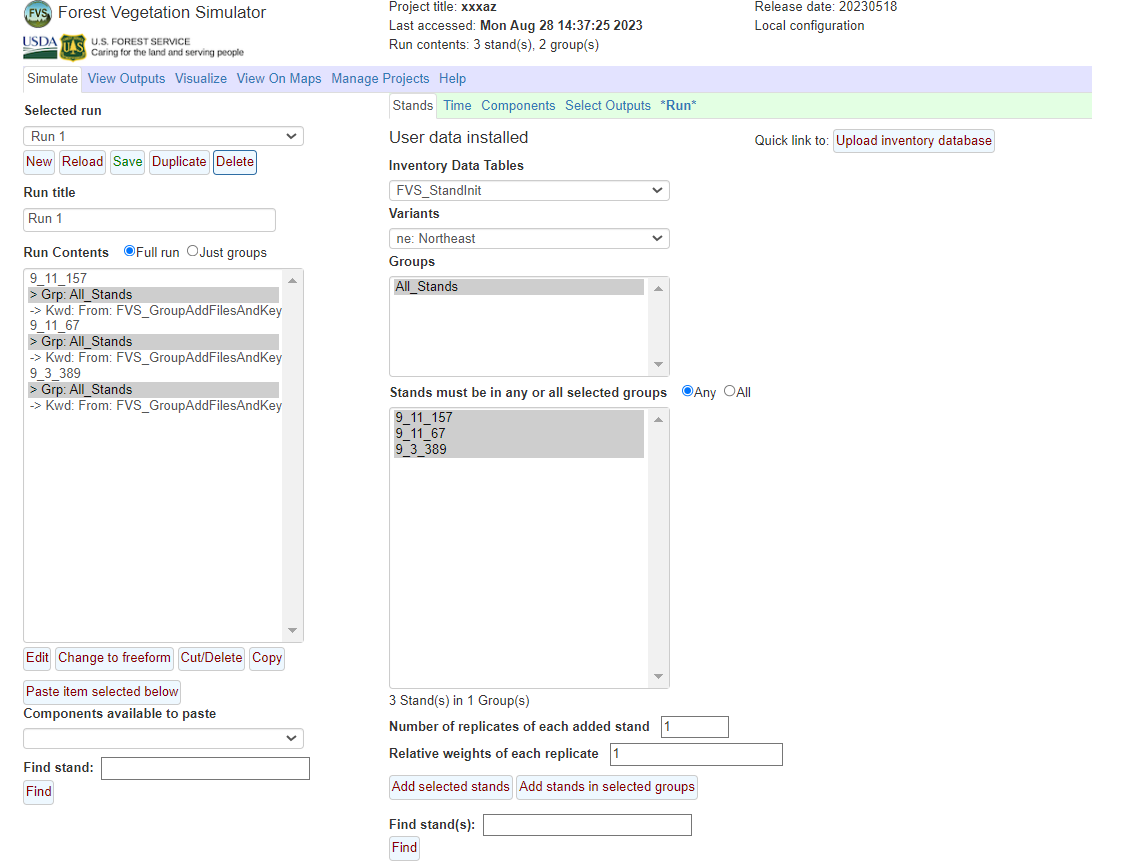
The FVS model has an excellent web interface, which can be downloaded here. I’ll use this interface and specify to use the Northeast variant to the FVS model.
The three stands in the Connecticut FIA data are labeled with stand identification numbers 9_11_157, 9_11_67, and 9_3_389. We can add all of them by pressing Add Selected Stands and include them in the Run Contents window:
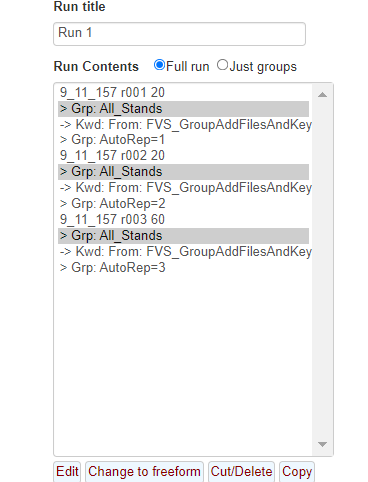
One approach that I’ve found effective in simulating adaptive silviculture treatments in FVS is through adding replicates with different weights. This approach is also described in an FVS Training Guide, and is similar to adding “subtreatments” within a stand. For example, if half of a stand is clearcut and half is not harvested, you could add two replicates with relative weights of 50% each, then perform the management actions within each replicate.
For the adaptive silviculture treatments planned for these stands, we can add three replicates with relative weights of 20%, 20%, and 60% corresponding to the gap, reserves, and thinning matrix subtreatments:

Now, you’re ready to specify the management actions within each subtreatment, or replicate.
Gaps subtreatment
For the first replicate, labeled r001, we’ll simulate the gaps subtreatment. This is essentially the harvested “group” in the group selection treatment where all trees are removed. For the purpose of this tutorial, we’ll use only stand number 9_11_157:
To specify the harvest within the gaps, select Regeneration Methods: Even-aged under the Categories drop down and then Clearcut/coppice under the Components drop down. The harvest will occur in 2023. We’ll specify the smallest diameter tree to be cut as 1-inch and will leave no legacy trees as a part of these gaps:
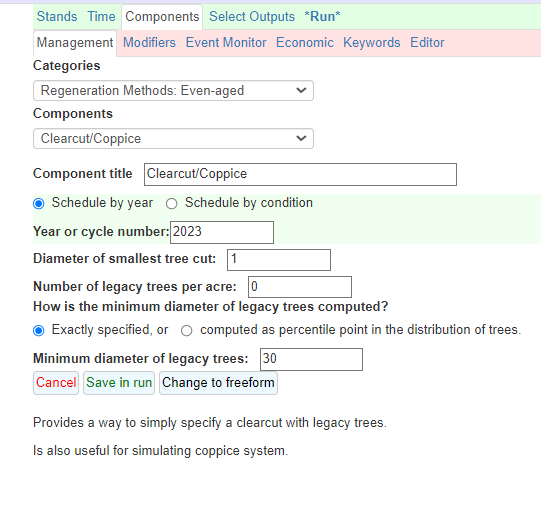
There will be plenty of light available in these gaps, so we’ll want to add some natural regeneration. The Northeast variant of the FVS model does not have a full regeneration module, so oftentimes regeneration needs to be manually entered. By default, the FVS-Northeast model does include regeneration from sprouting species like oaks and aspen. However, we’ll turn the sprouting feature off and will manually enter the species and number of trees to regenerate.
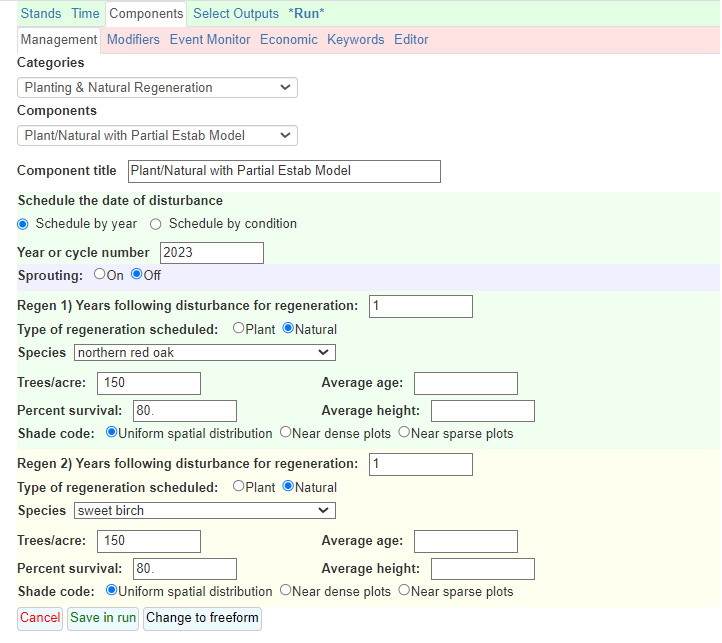
Select Planting & Natural Regen under the Categories drop down and then Plant/Natural with Partial Estab Model under the Components drop down. We’ll add 300 trees per acre to naturally regenerate in these gaps, evenly split between two species. After looking at the overstory species found in these stands, we’ll select northern red oak and sweet birch to regenerate, given there is likely plenty of seed source available. We’ll set the survival rate to 80% to account for some mortality through deer browse and other factors:
Reserve subtreatment
For the Reserve subtreatment (r002), there’s not much needed to do here. You can select the Grp: AutoRep=2 field in the Run Contents window of FVS, but don’t need to specify any management. We’re essentially running a “let it grow” scenario. Being a reserve treatment, we’ll simply let the current trees grow through the simulation and won’t add any regeneration.
Matrix subtreatment with thinning
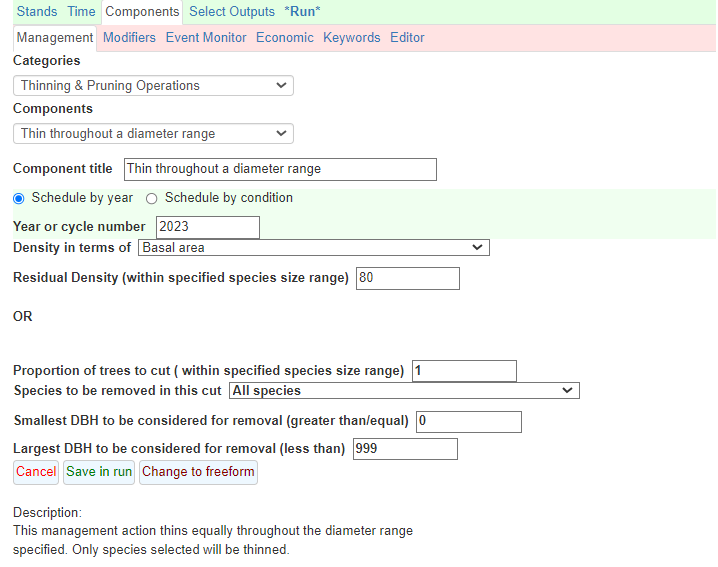
We’ll specify thinning to occur in the matrix subtreatment (r003). Select the Grp: AutoRep=3 field in the Run Contents window to apply the thinning treatments to the remaining 60% of the stand. Select Thinning and Pruning Operations under the Categories drop down and then Thin throughout a diameter range under the Components drop down. Thinning throughout will harvest trees from across the range of the diameter distribution.
The prescription calls for a thinning to leave 80 square feet of residual basal area per acre. Leave the default value to remove all species in the thinning:
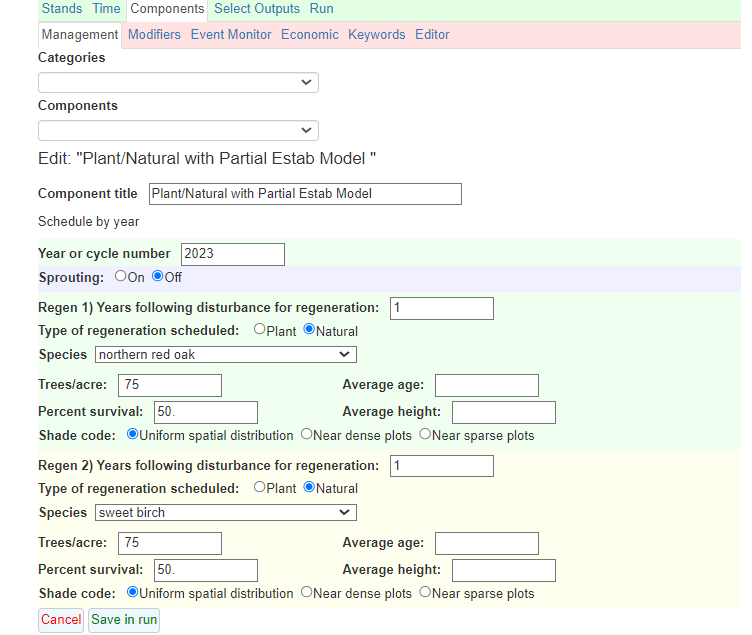
We’ll also add some natural regeneration within the matrix. However, because the residual trees will continue to occupy some light, we’ll add half the amount of regeneration in the matrix compared to what we added in the open gaps. We’ll add 150 trees per acre to naturally regenerate, turning off the default sprouting action. Again, the species will be evenly split between northern red oak and sweet birch. We’ll lower the survival to 50% to account for the limited light conditions in the thinned portion of the stand:
FVS output
We’ll run a 50-year simulation (through 2073), which can be changed under the Time window. Another keyword that I’ll set is NoTriple, which turns off the tripling of tree records early in the simulation. It can be found under the Keywords menu.
FVS provides multiple outputs to select from under the Select Outputs tab. I’ll choose Stand Visualization, Carbon and fuels, Stand structure, and Regeneration. Choose Save and Run under the Run window to perform the simulation.
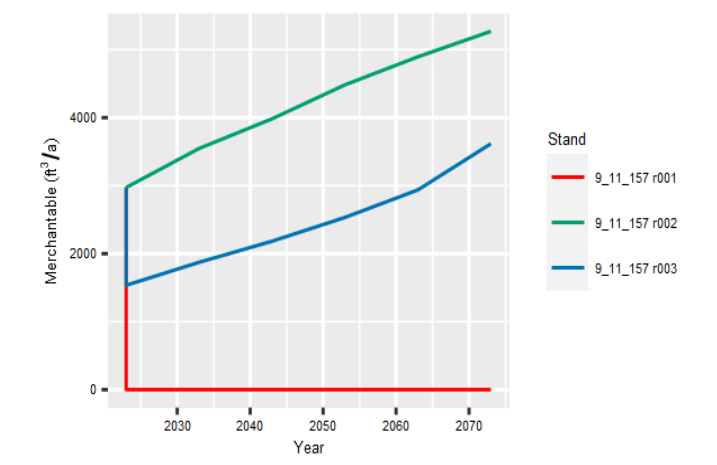
After the simulation is complete for this stand, select View Outputs, Explore, and then Graphs. You can see the merchantable volume trends within the gaps, reserve, and matrix subtreatments:
- For the gaps subtreatment (in red), all of the volume is removed, and by the end of the 50-year simulation our natural regeneration has not grown enough to yield any merchantable volume.
- For the reserve subtreatment (in green), the stand continues to grow throughout the simulation.
- For the matrix subtreatment (in blue), some volume is initially removed and growth continues throughout the simulation.
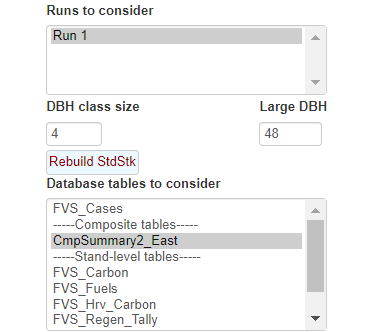
Despite the fact that we’ve simulated three subtreatments within a stand, FVS provides the Composite table in a format that weights the stand measurements calculated within each subtreatment. You can view the Composite table under Database tables to consider and selecting the CmpSummary2_East table:
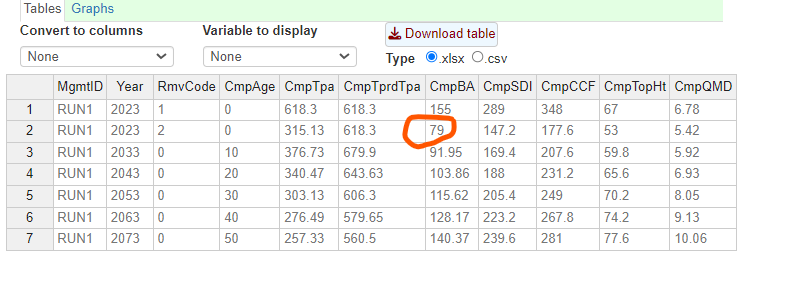
As you can see in the table, the composite residual basal area across the entire stand is 79 square feet per acre. You can quickly confirm this is correct by calculating a weighted average of the residual basal area in the gaps (0 square feet), the reserve (155 square feet, the initial basal area), and the matrix (80 square feet). These would correspond to the replicate weights of 20%, 20%, and 60% in the gaps, reserve, and matrix, respectively:
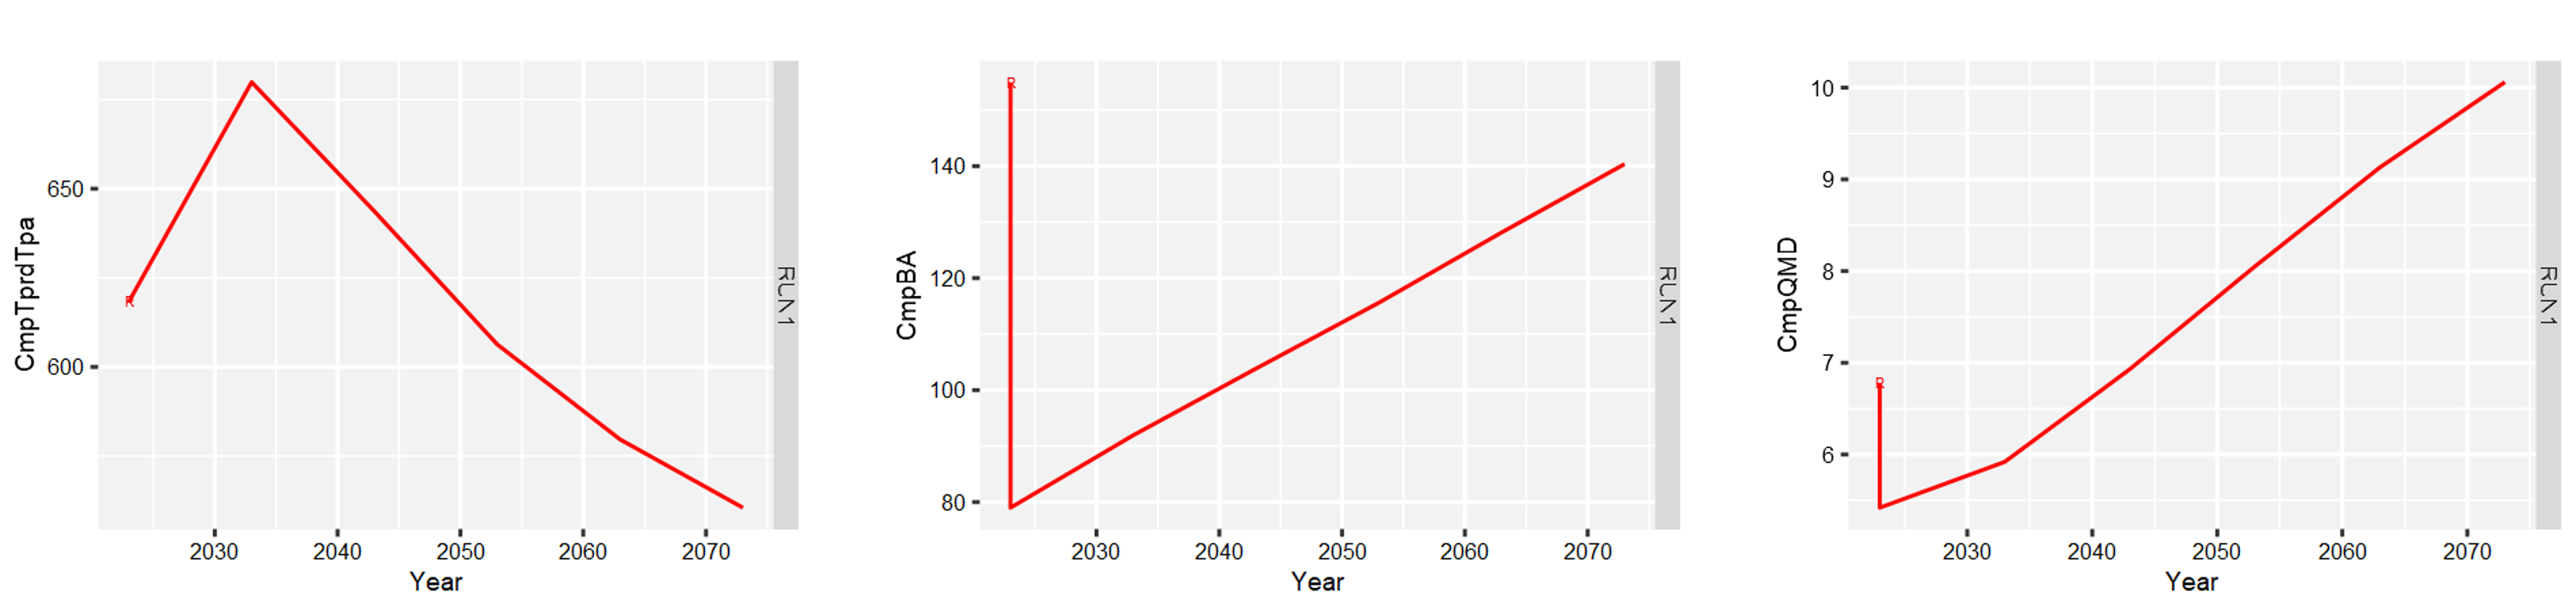
Finally, you can view more output by selecting View Outputs, Explore, and then Graphs. Here are the composite trees per acre, basal area, and quadratic mean diameter (QMD) across the stand. We can see the impact of adding the natural regeneration to the increasing trees per acre, then decreasing as the stands go through density-dependent mortality. Basal area and QMD are lowered immediately after harvest, then increase throughout the simulation:
Conclusion
Running adaptive silvicultural management in models like FVS is possible and can account for diverse harvest scenarios like thinning treatments, group selection harvests, and planting climate-adapted species. It’s important to note that FVS is a distance-independent model and doesn’t rely on a tree’s spatial location to determine growth and mortality. Many climate-adaptive forest management treatments rely on spatial heterogeneity as a part of maintaining diversity and resilience in the face of future uncertain climates. Unfortunately, few growth and yield models can incorporate spatial variability in addition to having the capability to forecast a variety of forest management treatments like FVS.
The process of adding subtreatments within FVS to account for different management actions and viewing the composite tables allows for the assessment of management impacts at the stand scale. Still, if many stands are run within FVS with multiple subtreatments, I like to export the data to other software like R and do my own calculations of stand-level attributes. Although models like FVS were not originally designed to incorporate complex forest management scenarios like adaptive silviculture, there are strategies to forecast what stands may look like under an adaptive management framework.
–
By Matt Russell. Check out the FVS-ready files on GitHub if you want to replicate this simulation, or try a another simulation using the other two stands. Email Matt with any questions or comments.