
Forest industry professionals have a renewed interest in understanding the extent to which forestland area has changed in regions where they procure wood. A few examples include:
- On June 30, 2023, the European Union implemented the European Union Deforestation-Free Supply Chain Regulation (EUDR), a process that bans imports into the EU marketplace if they originate from areas that have seen deforestation or forest degradation. All operators (including wood suppliers) will need to collect and maintain information on these products, including providing “adequately conclusive and verifiable information” that products are deforestation-free.
- The 2022 Sustainable Forestry Initiative’s (SFI) Fiber Sourcing Standard contains a performance measure to “develop and implement a due diligence system to manage the risk of sourcing fiber from controversial sources.” Controversial sources are defined in a number of ways and include “conversion sources originating from regions experiencing forest area decline.”
These issues alone make quantifying the extent of forestland area change necessary for forest products companies that export wood and seek to maintain compliance with certification standards. Fortunately, using over 130,000 forest inventory plots across the US, there are tools available to estimate forestland area change across states and regions.
This post describes how EVALIDator, a web-based application programming interface (API) created and maintained by the USDA Forest Service, can be used to estimate forestland area change. The program uses Forest Inventory and Analysis (FIA) data to determine estimates for several forest conditions of interest.
Obtaining forestland area change estimates
The EVALIDator program can be used to access a number of forest attributes. Importantly, it can be used to acquire estimates of change in forest conditions. It’s important to note that the amount and length of the data will vary depending on your region and state. Most states have data collected since the late 1990’s or early 2000’s when FIA implemented its annual inventory framework. This provides around 20 years of quality data to estimate changing conditions. Many states also have older “periodic” inventories where data were collected prior to this, but these data were not collected using the same nationally consistent framework that is used by FIA today.
For our example, we are interested in estimating how much forestland area has changed in the state of Minnesota over the last 10 years. Here are the steps to obtain those values:
- Open the EVALIDator API at https://apps.fs.usda.gov/fiadb-api/evalidator.
- On the first page, select State(s) retrieval as the Retrieval Type. Select Forest land from the land basis drop-down list. Select Area from the numerator drop-down list and select No denominator – just produce estimates from the ratio estimate drop-down list. Click Continue.
- From the drop-down list, select 2 – Area of forestland, in acres. Be sure that the radio buttons Use FIA definition of forest land and Limit retrieval to only most recent inventories are selected. Click Continue.
- Scroll down in the list of available evaluations and select MINNESOTA as the state. Note that these estimates will use FIA data collected between 2017 and 2021. Click Continue.
- Leave the Page variable section drop-down items selected to None and Current. For the row variable, scroll down to Forest type group and leave the row temporal basis set to Current. For the column variable, scroll down to Ownership group - major and leave the column temporal basis set to Current. Click Open estimates in new window.
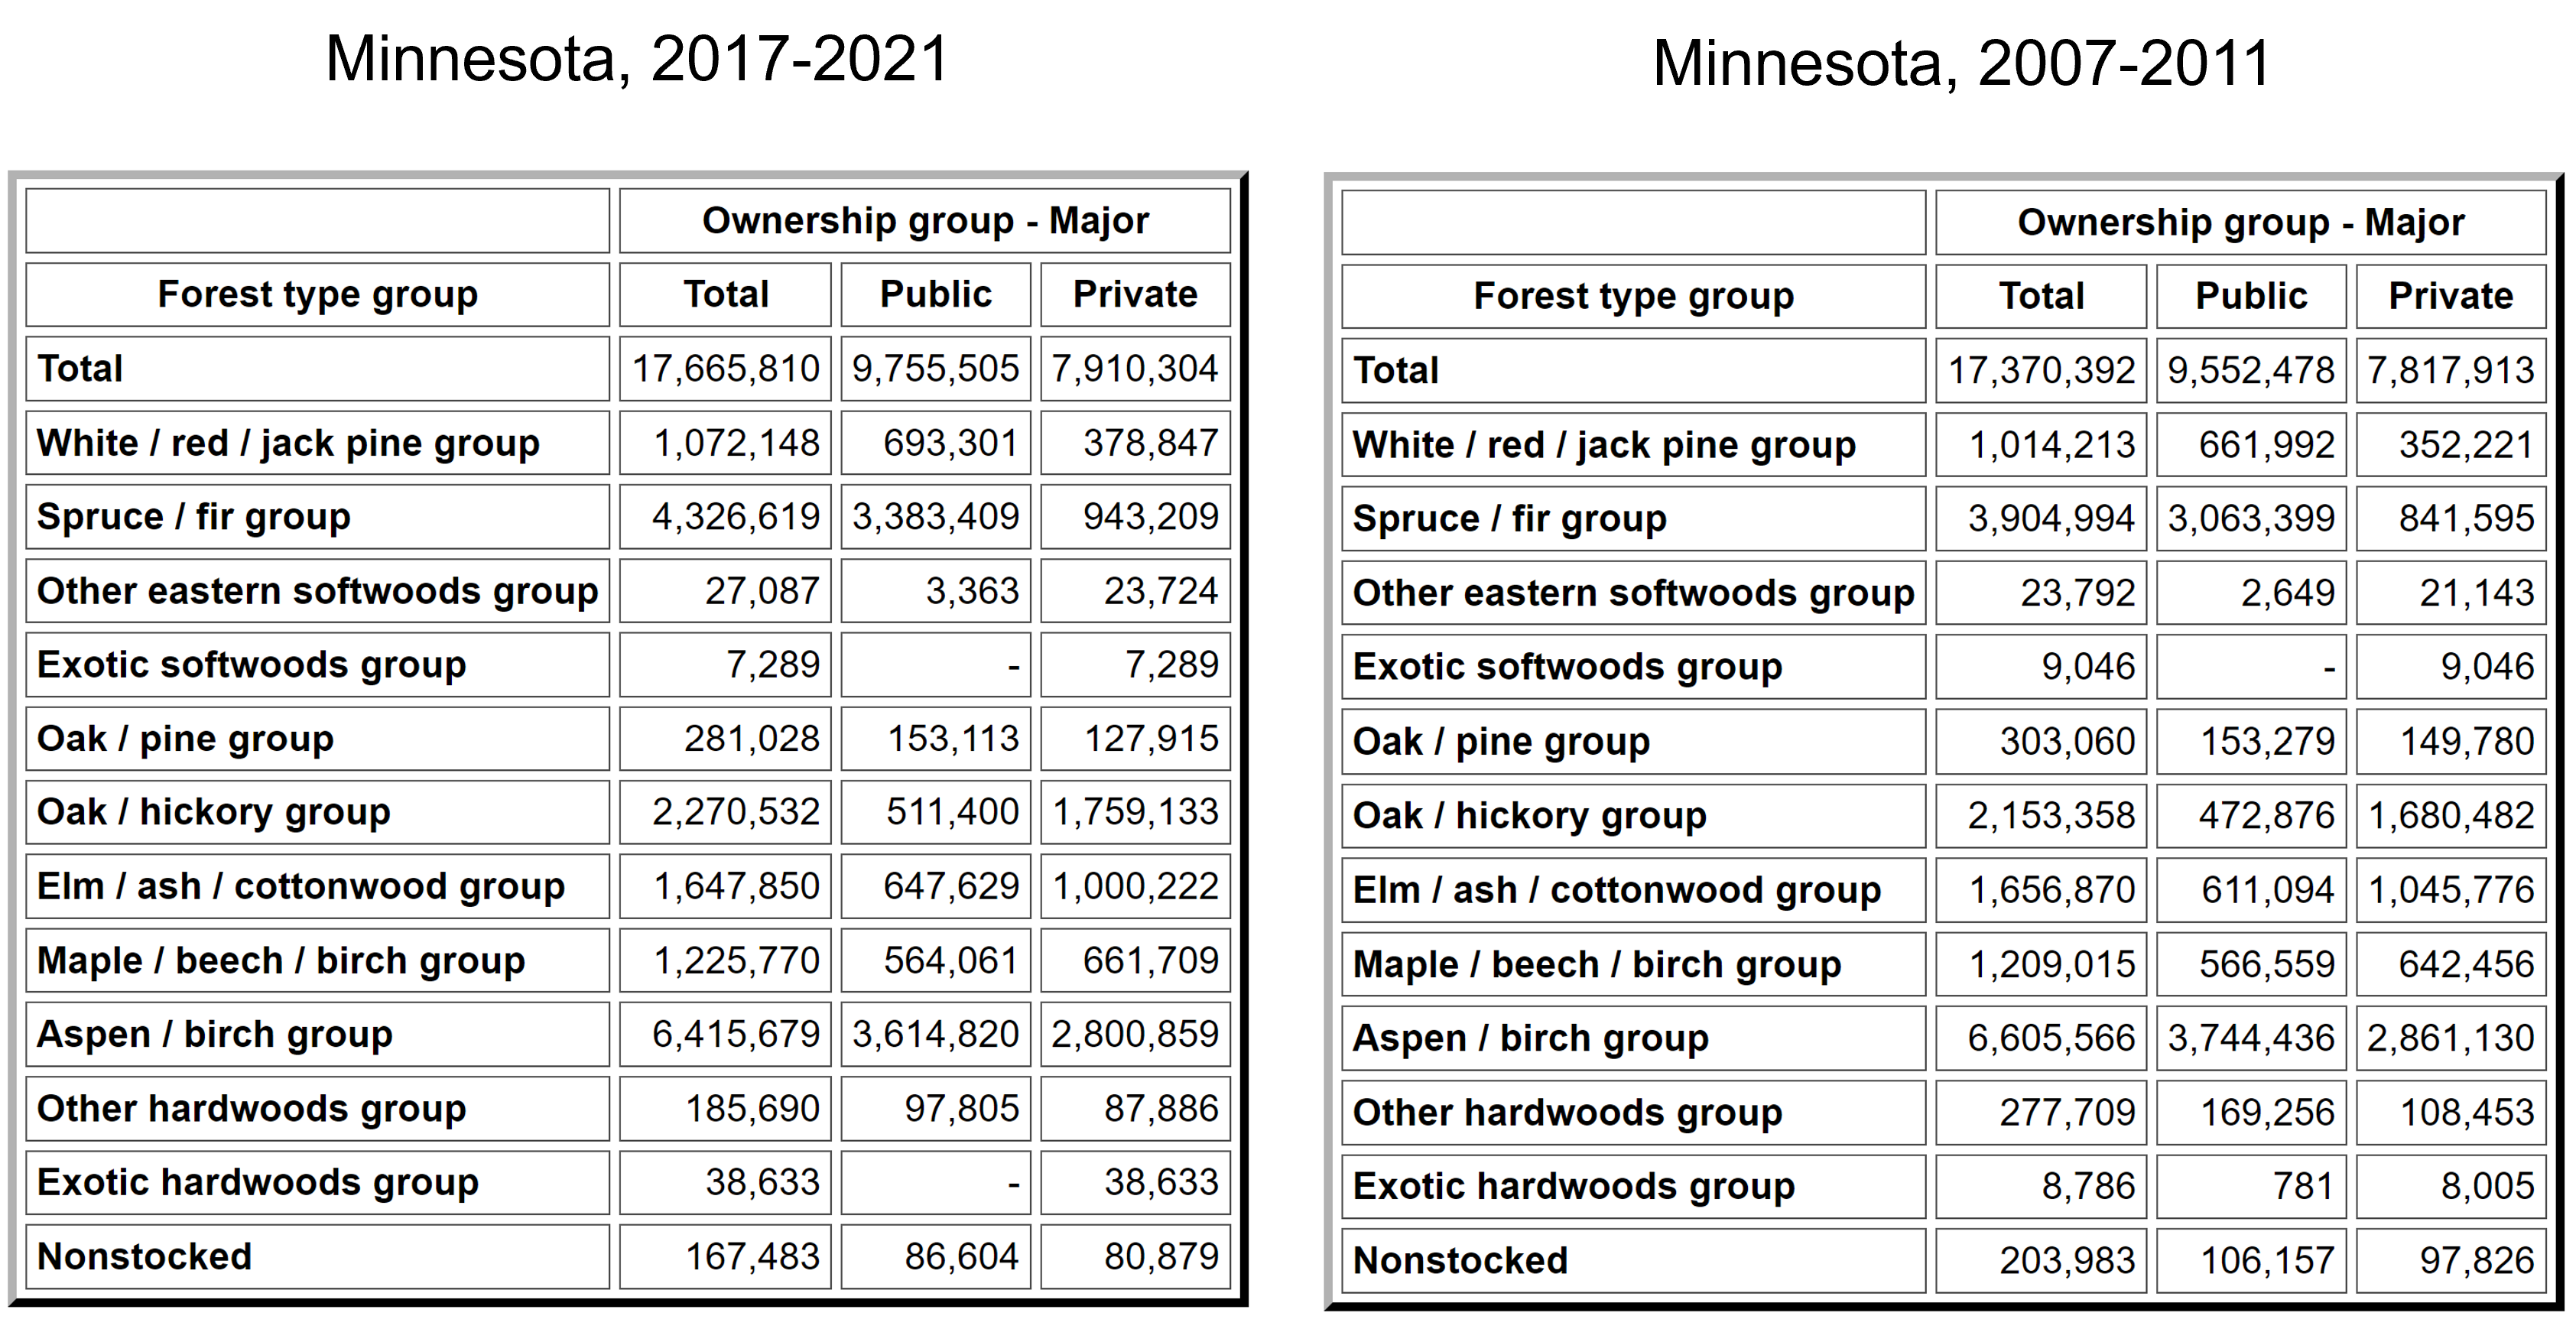
In the output, a Total row appears as the first column and first row. In total, current estimates show that 17.67 million acres of forestland exist in the state, measured from 2017 through 2021. More forestland area is found in public forests and the aspen/birch forest type group contains the largest acreage (Fig. 1).
Now we can use data compiled from a previous inventory in Minnesota to estimate forestland area change. This time, open the EVALIDator homepage in a new window and run a similar analysis. This time, on the second page, select Show all available inventories. Now you’ll see many rows for an individual state available with many years to choose from.
The FIA data are measured in a panel design where all plots in an inventory take several years to complete. In the eastern US, forests are inventoried on a five to seven year cycle, while western US forests are measured on a 10-year cycle. If we want to compare current forestland area estimates (2017-2021) with those from ten years prior (2007-2011), we can select 272011N MINNESOTA 2007;2008;2009;2010;2011 as the evaluation. On the next page, select Forest type group again as the row variable and choose Ownership group - major as the column variable.
The output based on the 2007-2011 data show a total of 17.37 million acres of forestland existing in Minnesota. Hence, the state has seen an increase in forestland area by 295,418 acres over the last 10 years. A closer inspection of forest types shows that some have decreased in area (e.g., aspen/birch) while others have increased (e.g., maple/beech/birch and oak/hickory; Fig. 1).
While this analysis used data collected across the entire state of Minnesota, users can also select more specific geographic regions tailored to their organization. For example, selecting a “circle retrieval” in step one on the EVALIDator web page will allow a user to input latitude and longitude coordinates to access data within a specified radius (e.g., 50 miles). This is helpful for understanding how forests have changed within wood procurement zones around a mill.
Similarly, if an organization has a list of counties where they have procured wood from in the past, the county within each state can be selected as a row or page variable in step 4 on the EVALIDator web page to obtain forestland area changes estimates within those counties. If this latter approach is done, be sure to look at the number of FIA plots that are being evaluated within each county in the EVALIDator output to make sure there is a suitable number of them being used (say, greater than 25 plots) to generate the estimate.
Conclusion
In addition to understanding current forest conditions, the EVALIDator web tool can also provide estimates of changes to forests such as forestland area change. While there remains uncertainty about the information required by companies in regulations outlined in the EUDR and SFI’s Fiber Sourcing Standard, you and your organization can be prepared knowing how to access FIA data to show that wood does not originate from areas that have been deforested or seen significant forestland area change.
–
By Matt Russell. For more, subscribe to my monthly email newsletter to stay ahead on data and analytics trends in the forest products industry.
This was previously published as a Technical Review for the Forest Resources Association.