| State | Standing dead carbon (mt CO2-eq/ac) | Downed dead carbon (mt CO2-eq/ac) |
|---|---|---|
| Alabama | 2.27 | 5.76 |
| Alaska | 13.55 | 24.07 |
| Arizona | 3.00 | 4.82 |
| Arkansas | 2.12 | 6.79 |
| California | 12.54 | 13.26 |
| Colorado | 11.89 | 10.21 |
| Connecticut | 7.11 | 8.66 |
| Delaware | 3.67 | 7.19 |
| Florida | 2.46 | 5.05 |
| Georgia | 2.26 | 5.78 |
| Hawaii | 10.10 | 11.92 |
| Idaho | 15.77 | 16.78 |
| Illinois | 4.88 | 9.25 |
| Indiana | 5.31 | 15.98 |
| Iowa | 3.98 | 10.99 |
| Kansas | 3.10 | 4.91 |
| Kentucky | 3.13 | 9.07 |
| Louisiana | 2.64 | 4.95 |
| Maine | 4.07 | 9.33 |
| Maryland | 4.81 | 9.45 |
| Massachusetts | 6.11 | 10.98 |
| Michigan | 4.53 | 8.35 |
| Minnesota | 3.85 | 7.61 |
| Mississippi | 2.56 | 3.97 |
| Missouri | 3.57 | 7.28 |
| Montana | 13.84 | 15.33 |
| Nebraska | 2.11 | 8.49 |
| Nevada | 2.14 | 3.49 |
| New Hampshire | 5.13 | 8.01 |
| New Jersey | 5.88 | 8.62 |
| New Mexico | 3.31 | 4.10 |
| New York | 5.58 | 8.88 |
| North Carolina | 3.26 | 6.27 |
| North Dakota | 2.90 | 8.24 |
| Ohio | 4.01 | 10.34 |
| Oklahoma | 2.03 | 5.31 |
| Oregon | 11.46 | 19.40 |
| Pennsylvania | 5.55 | 17.40 |
| Rhode Island | 8.21 | 14.66 |
| South Carolina | 1.77 | 5.66 |
| South Dakota | 2.78 | 8.00 |
| Tennessee | 3.25 | 8.19 |
| Texas | 1.91 | 5.39 |
| Utah | 5.72 | 6.89 |
| Vermont | 4.66 | 9.40 |
| Virginia | 4.20 | 6.92 |
| Washington | 15.08 | 25.49 |
| West Virginia | 3.84 | 11.97 |
| Wisconsin | 3.40 | 7.50 |
| Wyoming | 17.92 | 18.85 |
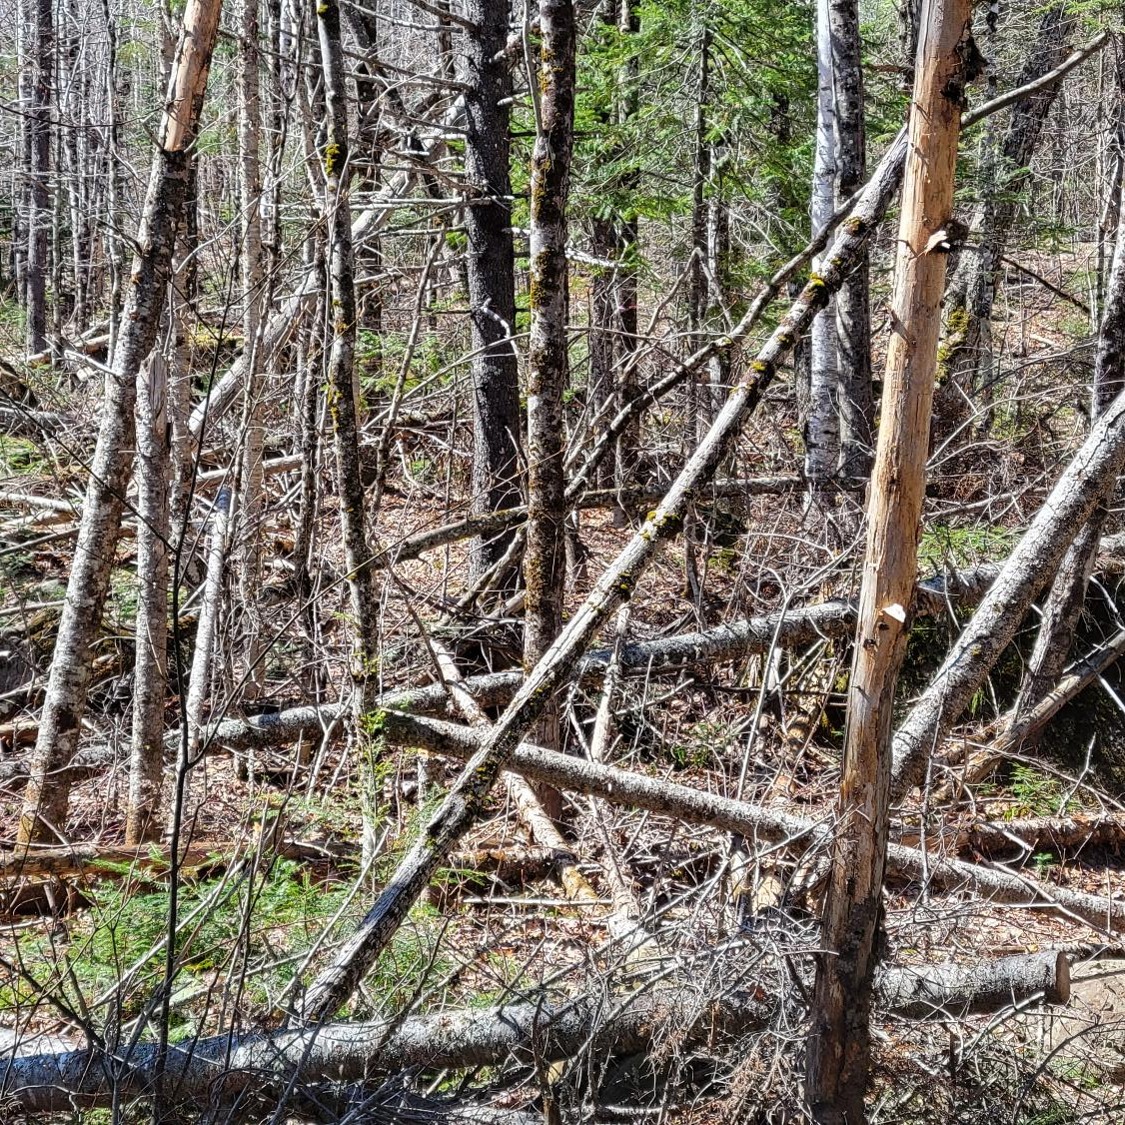
Dead wood is an important forest carbon pool that needs to be quantified in unique ways. Notably, the amount of carbon in dead wood has increased considerably in recent decades. Carbon in deadwood has increased by 61% since 1990, a rate that has outpaced the accrual of carbon in live trees.
Dead wood is sampled in two different pools: standing dead trees and downed dead wood. In forest carbon project development, these two dead wood pools are often labeled as “optional” categories to include when determining forest carbon credits.
If a developer chooses to include one of these pools, it’s likely the standing dead trees. Standing dead trees are sampled with the same approach as live trees and determining carbon stored in them is similar to live trees. Downed dead wood is typically sampled with transects that take additional time to collect in the field. Quantifying downed dead wood volume, biomass, and carbon requires a different approach compared to standing dead trees.
So what are the relationships between carbon in standing and downed dead wood? I’ve often wondered this when I come across carbon projects that choose to quantify standing but not downed dead wood. In other words, how much carbon is in the forest but not a part of the carbon project?
Dead wood data
The Forest Inventory and Analysis program’s EVALIDator application was used to gather data on both dead wood pools for each US state. For standing dead wood, the attribute of interest was aboveground carbon in standing dead trees at least 1-inch DBH, on forest land.
Determining a comparable value for downed dead wood was a bit more tricky due to the sampling approach used by FIA for downed wood. The following pools were added together to arrive at all downed dead wood greater than 1-inch in size:
- Coarse woody debris, comprising all dead and downed pieces or portions of pieces of wood greater than 3 inches and
- Large fine woody debris, comprising all downed woody pieces with a diameter between 1 and 3 inches.
There is additional fine woody debris sampled less than 1-inch in diameter, in addition to woody debris sampled in piles. But for these purposes, consider the comparison between all dead wood greater than 1-inch in diameter.
More dead wood is downed than standing
Across the 50 US states, total carbon stored in standing and downed dead pools is 6.3 and 10.0 mt CO2-eq/ac. So, downed dead wood is roughly 1.6 times greater than the standing dead wood pool. Within the downed dead wood pool, coarse woody debris makes up 77% of total carbon.
The largest amount of standing dead wood was observed in Wyoming with 17.92 mt CO2-eq/ac. The largest amount of downed dead wood was observed in Washington with 25.49 mt CO2-eq/ac.
The downed: standing dead wood ratio is a useful value that can be used to compare the two pools. Only one state, Colorado, shows a ratio less than one, indicating greater standing compared to downed dead wood. States that show the lowest ratios are located in the western US where recent large scale disturbances have lead to lots of tree mortality.
All other 49 states have ratios that indicate greater downed dead wood carbon stocks:
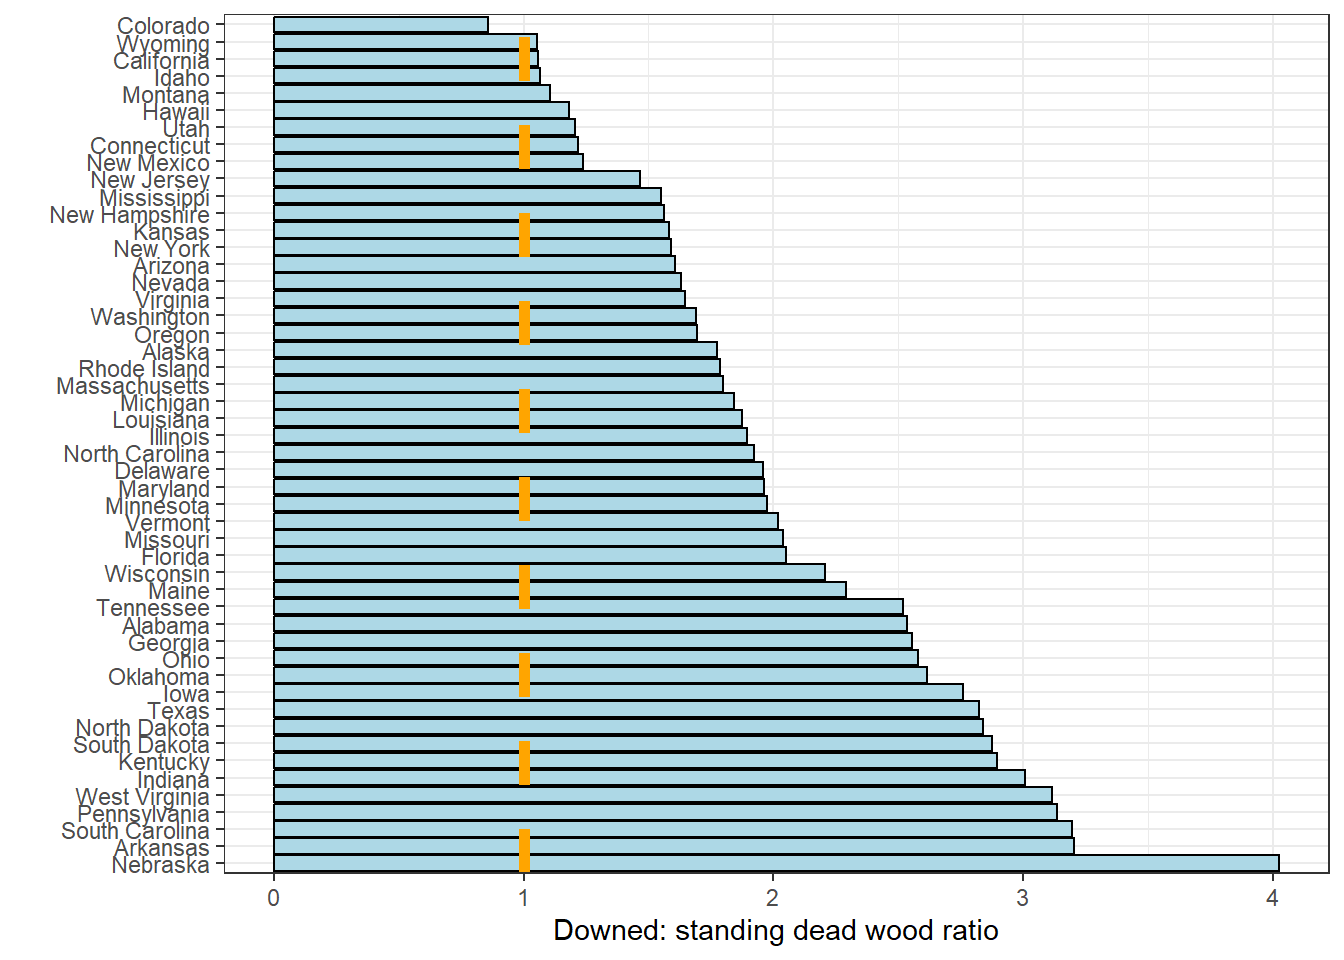
These numbers can help carbon project developers in quantifying the contribution of different carbon pools. Don’t underestimate how much dead wood can contribute to total forest carbon stocks.
–
By Matt Russell. Subscribe to our monthly email newsletter for data and analytics trends in the forest products industry.