| Species | SDImax (Default FVS-NE) | SDImax (Woodall + Weiskittel 2021) |
|---|---|---|
| Balsam fir | 655 | 541.6 |
| Red spruce | 506 | 541.6 |
After running the Forest Vegetation Simulator using data collected from an inventory, it can leave you with an optimistic feeling about your forest. Look at the growth rate! This stand is healthy and vigorous! Unfortunately many growth and yield models like FVS are known to overestimate forest growth and underpredict mortality.
While it’s encouraging to see good growth rates in your model output, it’s also misleading and won’t capture the right forest dynamics. This unrealistic growth is a “watermelon metric” that analysts should be aware of.
When models overpredict growth, it means calibrations are needed to align predictions with expected growth dynamics. Not calibrating model output can lead to growth dynamics that are too unrealistic for management and planning purposes.
Unfortunately, calibrating a model like FVS can take considerable time and effort to do right. But there are several small tweaks an analyst can do to get the model’s output to align with expected growth rates. Think about this like exercise: someone that hasn’t jogged a mile since high school is out of shape, especially compared to a person training for a marathon that runs 50 miles a week. But someone that runs three times a week for 30 minutes is in considerable shape compared to our couch potato. There is a place for marathoners in the in the forest analytics community, but we need more three-times-a-week runners, too.
I call this calibrating FVS “on a budget.” Here are a few actions of what I mean by that:
- Using all available data collected in the forest inventory as inputs to the FVS model (e.g., tree height, site index).
- Specifying a few select keywords in FVS with values that are localized to your forest, ideally from your own company or organization’s historical records or from peer-reviewed studies.
Here are a few examples of what calibrating on a budget is not:
- Spending weeks at a time calibrating a model with localized data,
- Investing hundreds of hours in your team’s time in tweaking model keywords and results,
- Iteratively running model simulations over and over to find the right calibrations, wasting resources in compute time. (I’ve done this, and while it pleased academics, I can tell you it was a brute force method.)
In this post, the first in a series on calibrating FVS on a budget, we’ll address one of the common issues of FVS in eastern variants: that growth is overestimated because mortality isn’t great enough. In many eastern variants of FVS, the maximum stand density index (SDImax) is a key determinant of stand dynamics. This post will discuss a calibration to SDImax that can lead to quick improvements in the performance of FVS.
Case study: Maine spruce-fir data
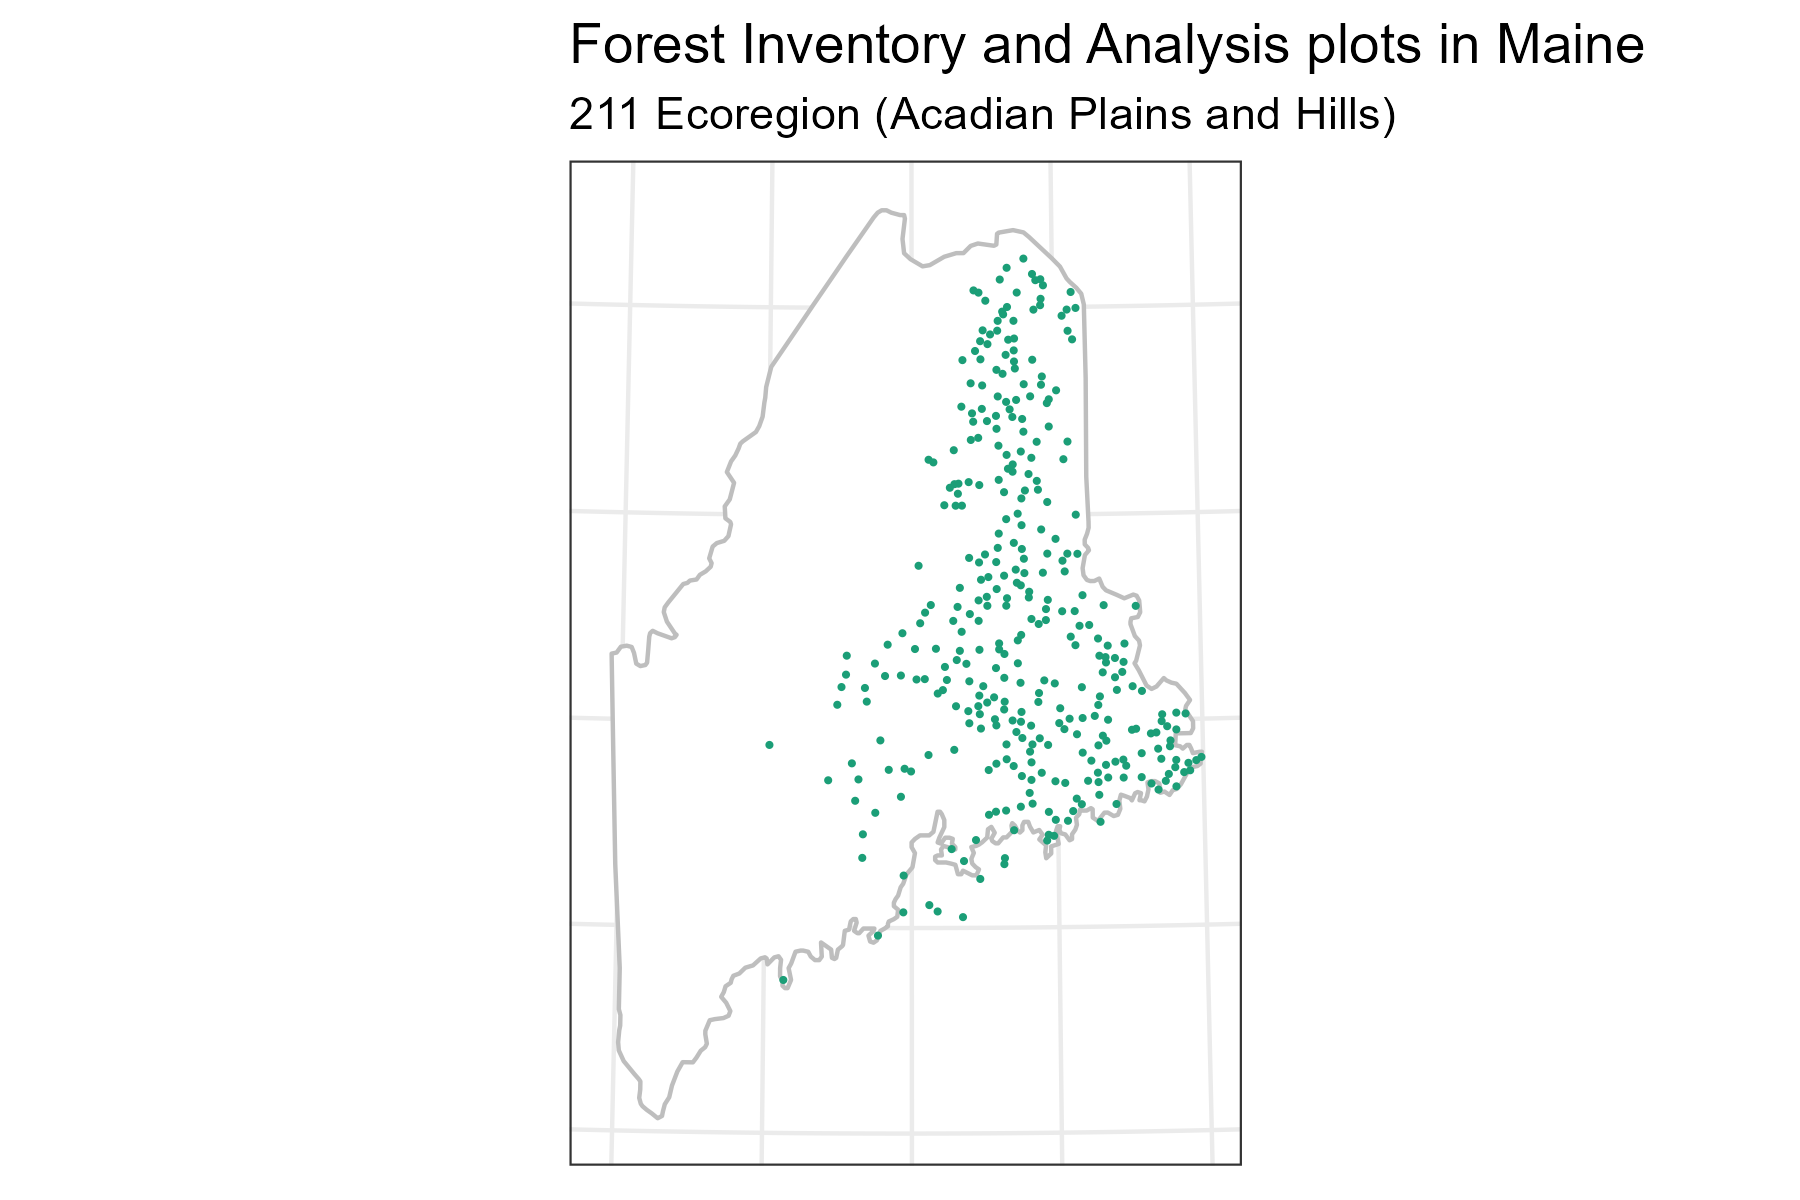
Forest Inventory and Analysis plots were queried from the state of Maine to create a tree list for use in FVS. All plots were measured between 2020 and 2024. These plots were further queried to select all single-condition plots on timberland in the spruce/fir forest type group (FORTYPGR = 120) found in the Acadian Plains and Hills ecoregion (ecoregion 211). In total, 332 plots with 18,869 tree observations were used.
The Northeast variant of FVS was used to model tree and stand development. The model was run in two scenarios for 50 years, including a non-calibrated version of the model using default values (“FVS out-of-the-box”) and a version of the model where a modification to the SDIMAX keyword was made.
The modified scenarios used the SDIMAX values based on the work of Woodall and Weiskittel (2021), which provides updated maximum stand density index values by forest type. This Excel-based stand density index and relative density calculator contains the updated maximum stand density index values by forest type and ecoregion, along with some handy drop downs and a map to see how the values interact across forest conditions.
By default, FVS uses species-specific SDImax values. The modifications were made by replacing the default SDImax values with the SDImax value for all species in the spruce/fir forest type. This was done using the SDIMAX keyword in FVS:
Before any calibration exercise, it’s a prerequisite to know what values to calibrate to. This is where historical growth rates in your company or organization come in handy. In the absence of any local data, data from the Forest Inventory and Analysis EVALIDator web application can be used to get a sense of the growth rates you should expect. All FIA data can be queried to the forest type, region, or stand age class level, among several other variables.
To compare growth rates, FIA data were summarized to calculate the average net growth for spruce/fir stands in Maine. This query summarizes the average annual net growth of merchantable bole wood volume of growing-stock trees (at least 5 inches d.b.h.), in cubic feet, on timberland, and calculates it on a per acre basis.
The FIA output uses all spruce-fir plots collected in Maine between 2020 and 2024, drawing from 1,050 FIA plots across the state. Total volume growth across all ownerships in spruce-fir forests is 40.7449 cubic feet/ac/yr. After assuming 85 cubic feet per cord (a common conversion in the Maine woods), we can assume a growth rate of 0.48 cords/ac/yr. This value was used as a benchmark to compare the growth rates from FVS.
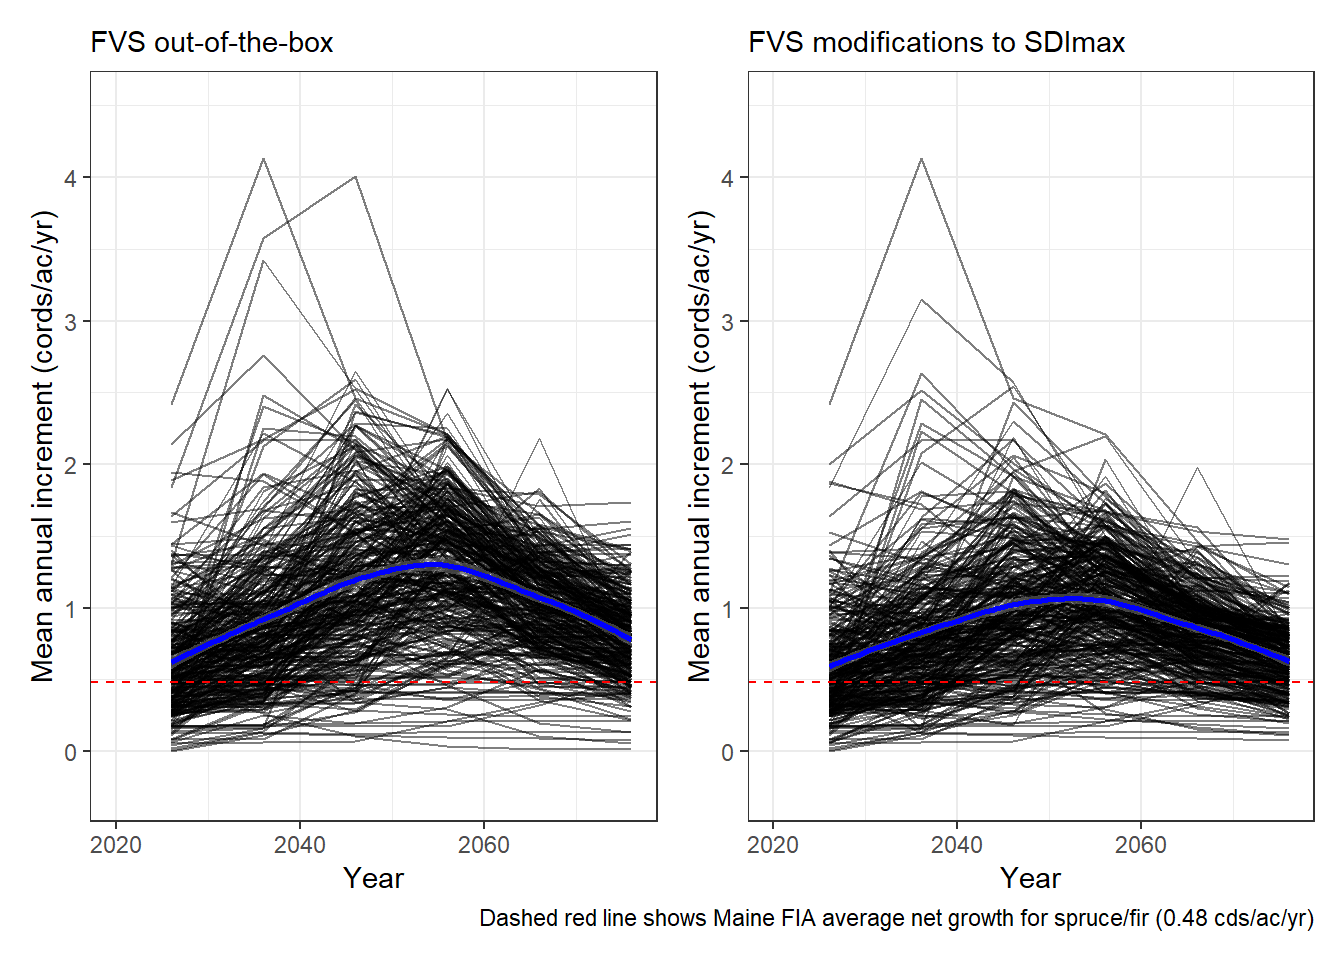
A handy metric that depicts growth from FVS is the mean annual increment variable(MAI) from the FVS_Summary2 table. After simulating growth in FVS, the MAI of merchantable volume was investigated for each stand and year in the out-of-the-box and SDImax-modified scenarios. A few key highlights of results:
- In the out-of-the-box scenario, average MAI in these stands was 1.06 +/- 0.54 cords/ac/yr (mean +/- SD).
- Including the SDImax modification lowered the average MAI to 0.89 +/- 0.46 cords/ac/yr.
- Both estimates are higher than the FIA average net growth rate of 0.48 cords/ac/yr, but the SDImax modifications brought the FVS growth rates closer to the FIA benchmark.
Simulating the spruce/fir FIA plots in Maine indicated peaked growth around year 2050, with the SDImax modification showing a peak slightly less than the out-of-the-box scenario:
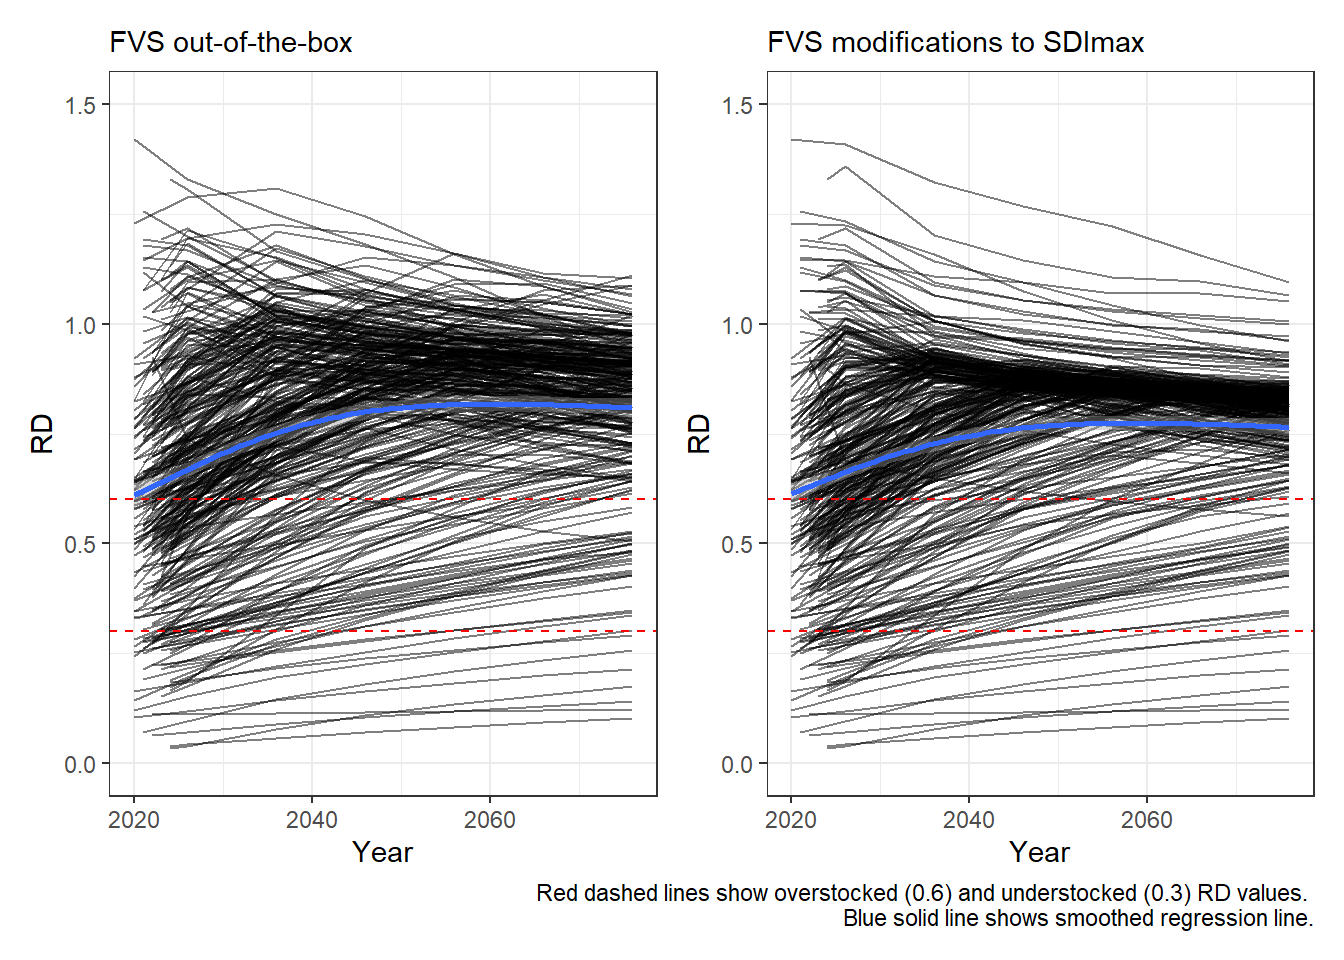
Most stands showed overstocked conditions (i.e., when relative density [RD] was > 0.6) soon after the start of the simulation. In both scenarios, RD increased initially, then leveled off. The modifications to SDImax did not substantially change the RD trajectories:
A few highlights from this case study:
- Changes to SDImax are just one feature of calibration. These results show that changing the SDImax value for a few species can better address density dependent mortality, which can better align growth rates to what’s expected (i.e., around half a cord per acre per year in Maine).
- Calibrating growth is needed to get more realistic rates. The modifications to SDImax alone did not substantially change trajectories in relative density, but it did lower growth rates closer to the expected value.
- Additional modifications are needed. This analysis changed a single keyword related to mortality and stand development. More work is needed to adjust growth rates and incorporate regeneration using this case study.
On the whole, a better alignment of FVS-projected growth of 0.89 compared to 1.06 cords/ac/yr, when our benchmark is 0.48 cords/ac/yr, should provide some optimism. The modified scenario adds a single keyword yet results in growth estimates that are likely capturing density-dependent mortality and are removing the substantial overestimation of growth in the model. We have some more work to calibrate this scenario in FVS, but we’re on the right track.
–
By Matt Russell. Subscribe to our monthly email newsletter for data and analytics trends in the forest products industry.