This is the next post in the Calibrating FVS on a budget series. Check out last month’s post for our results on calibrating the mortality component of FVS.
In last month’s post we were able to better align FVS-projected growth of spruce-fir stands in Maine. We brought the average annual growth down from the overpredictions that FVS made out-of-the-box (i.e., in a non-calibrated version). Growth is still too high relative to our target growth of 0.48 cords/ac/yr (informed from Forest Inventory and Analysis data), but we knew we headed in the right direction.
Another key component of forest growth modeling is regeneration. One of the drawbacks with FVS is that for many of its eastern variants, regeneration or “ingrowth trees” are not incorporated into default model runs. This lack of a regeneration model hinders the evaluation of forest growth in many regions like the eastern US that rely on natural regeneration to form future forests.
Modeling regeneration can take a few approaches. As discussed in Weiskittel et al. 2011 discuss in their Chapter 9, regeneration modeling can take to approaches: static or dynamic. Static regeneration modeling assumes a set number of new trees being recruited over a given time period. Dynamic regeneration modeling involves predicting how many new trees are added based on stand conditions such as basal area, canopy cover, stand age, or other factors. This post will focus on a static regeneration approach (…remember we’re doing our modeling on a budget). There are some variants of FVS that perform dynamic regeneration modeling.
Including regeneration within FVS can help in predicting the structure and composition of future forests. Fortunately, FVS has several ways to add regeneration (either natural or planted) to model runs, termed a “partial” establishment model. Many FVS variants also allow certain species to “sprout”, each with a different probability according to species or tree size. The sprouting feature in FVS can also be turned off.
Reliable data should be used if a user wants to understand the amount of trees that regenerate on a regular basis and how these relate to stand conditions. These data often come from permanent sample plots, data which are extremely valuable for understanding regeneration patterns. A few approaches that may help in determining regeneration inputs:
- Base it on forester knowledge. Most foresters will know which species are occupying the understory and have the potential to grow into the canopy. Use local knowledge about the typical number per acre and species of these trees for a given set of stand conditions, and input them into your simulation.
- Collect microplots to inform regeneration. Data collected from microplots in forest inventories are often disregarded because the seedlings and saplings found in them have little volume and store minimal carbon. While data collected in microplots can show high variation, collect and analyze these data to inform the quantity and species to input as regeneration into FVS.
- Analyze FIA data. If you have little data of your own, FIA data may be able to help with your forest type and region. The FIA field crews record the number of ingrowth trees on microplots through the RECONCILECD variable. You can see which species are regenerating in your forest type. We did an analysis with FIA data that helped us parameterize the Lake States variant of FVS using this approach.
Whichever the approach, incorporating new seedlings adds a baseline of background regeneration to your forest growth simulation. This should be incorporated when doing long-term projections in forests where regeneration is common but generic models don’t include it.
Case study: Maine spruce-fir data
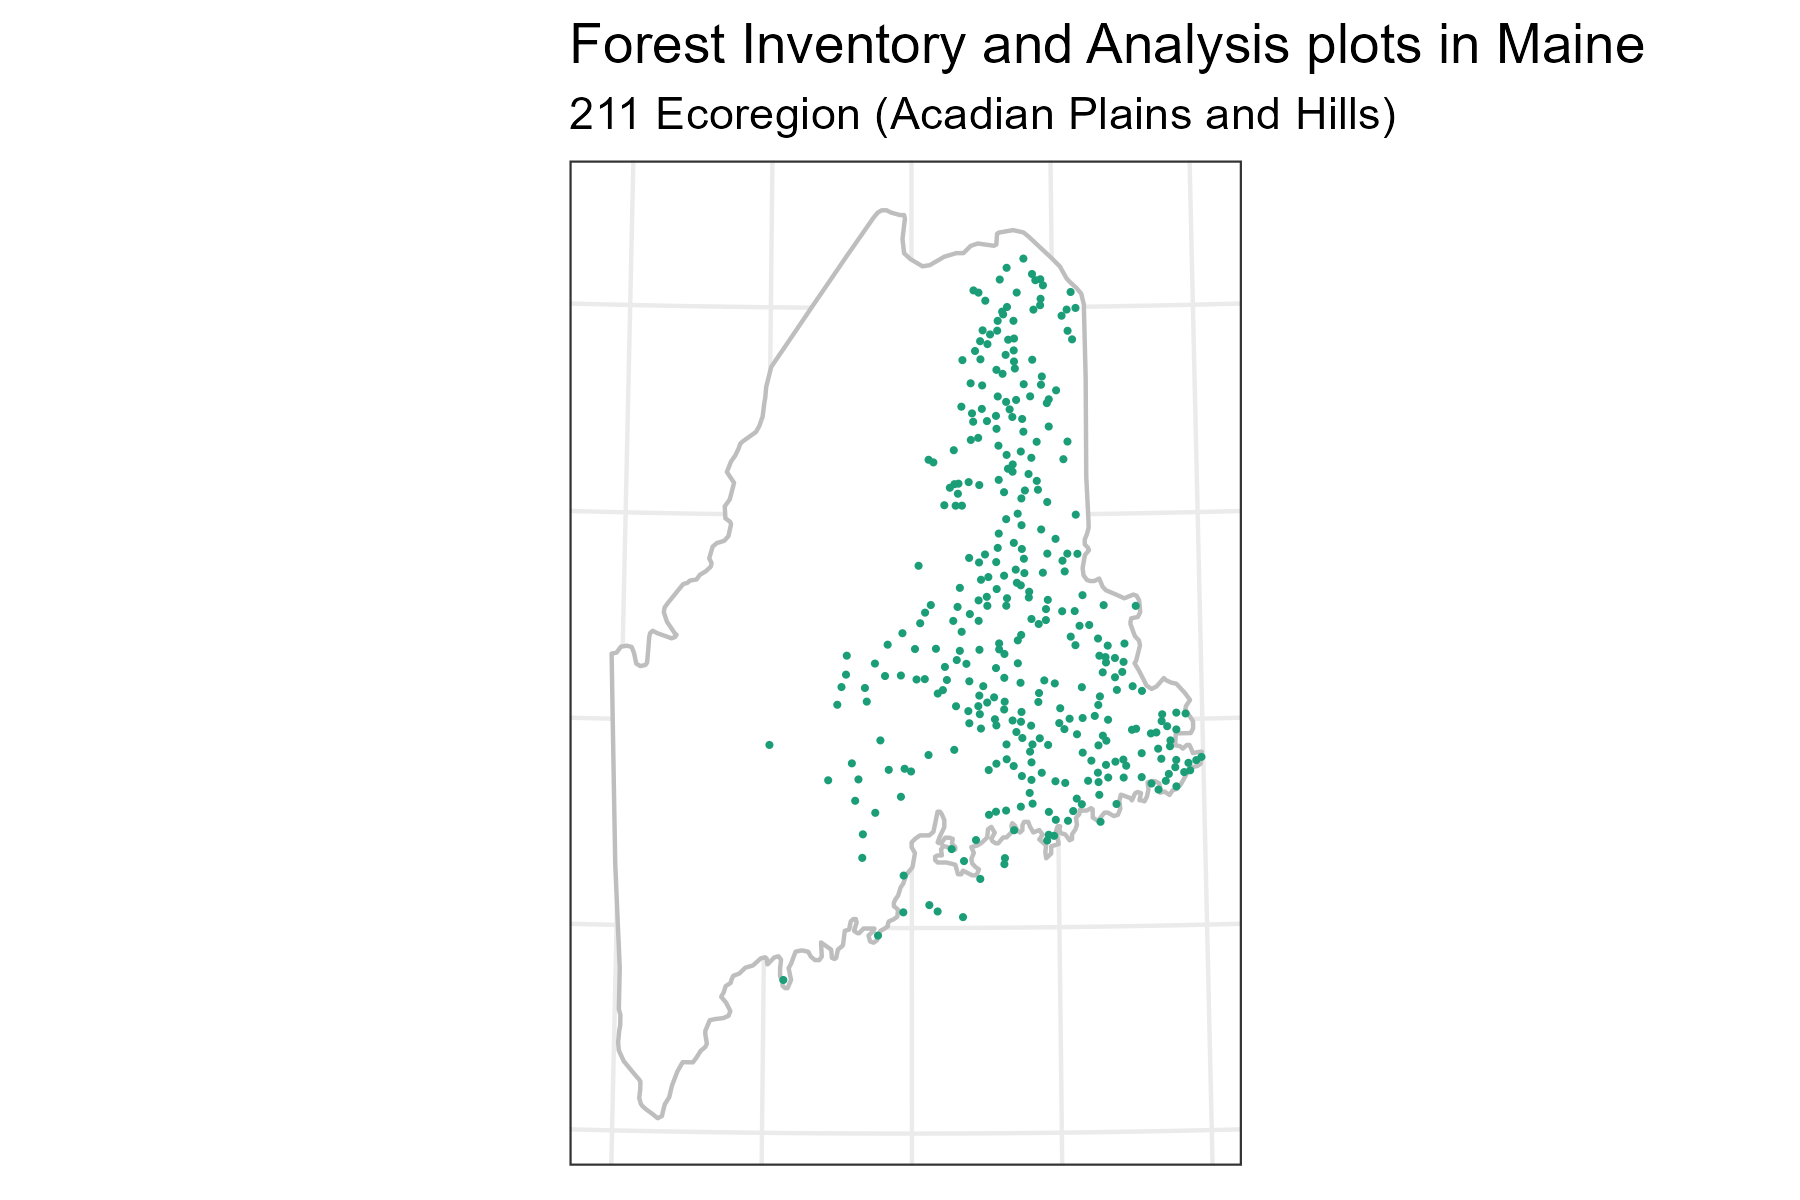
This example uses Forest Inventory and Analysis plots were from Maine to create a tree list for use in FVS. All plots were measured between 2020 and 2024. These plots were further queried to select all single-condition plots on timberland in the spruce/fir forest type group (FORTYPGR = 120) found in the Acadian Plains and Hills ecoregion (ecoregion 211). In total, 332 plots with 18,869 tree observations were used.
Following up on the previous post which used the Northeast variant of FVS, this analysis was built off the simulation that changed the SDIMAX keyword in FVS. Adding regeneration in FVS can be done with the NATURAL or PLANT keywords. For this example, I added background regeneration to the model runs at every FVS cycle (i.e., every 10 years in the Northeast variant). The following species and numbers of seedlings were added every 10 years:
- Balsam fir, 25 seedlings per acre
- Red spruce, 25 seedlings per acre
This insured a continuous input of regeneration into the simulation, a reflection of the shade tolerance of these species and what foresters would expect to see.
Remember, our interest iss in calibrating the model to a target growth rate of 0.48 cords/ac/yr a value informed by FIA data.
- In the out-of-the-box scenario, average mean annual increment (MAI) in these stands was 0.97 +/- 0.50 cords/ac/yr (mean +/- SD).
- Including the SDImax modification lowered the average MAI to 0.82 +/- 0.42 cords/ac/yr.
- Including the SDImax modification along with adding natural regeneration essentially doesn’t change the growth rate: average MAI is still 0.82 +/- 0.42 cords/ac/yr.
- The estimates will regen are still higher than the FIA average net growth rate of 0.48 cords/ac/yr, but we’re getting somewhere.
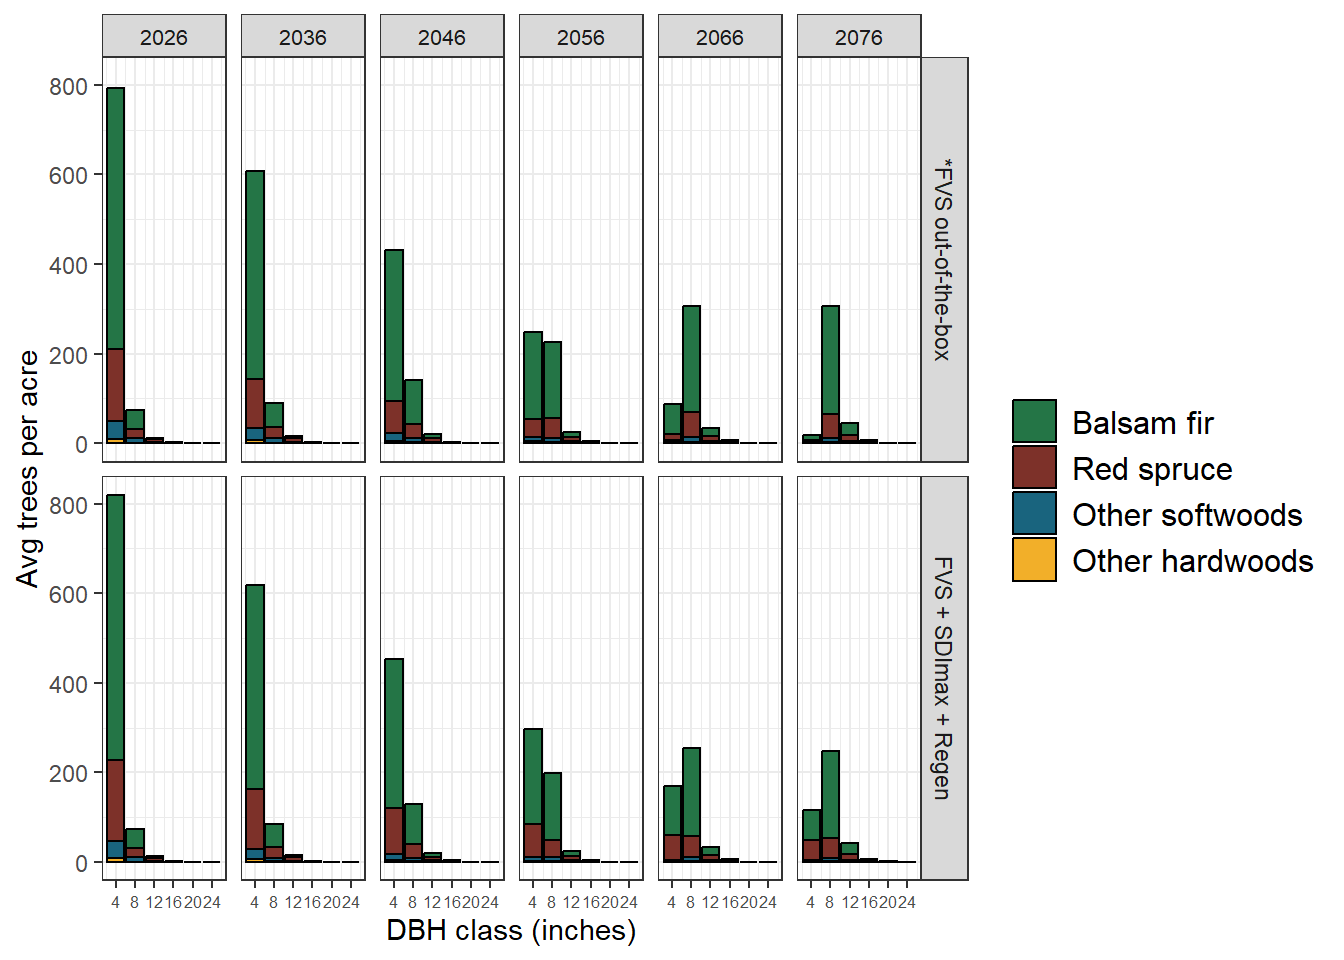
As expected, adding regeneration increases the number of small-diameter trees in the model. The following graph shows stocking charts throughout the 50-year simulation. Note the greater amount of smaller-diameter trees (i.e., in the 4-inch diameter class) in the scenario that modies SDImax and adds regeneration compared to the out-of-the-box scenario:
A few highlights from this approach:
Adding regen doesn’t increase the overall growth rate, but it doesn’t lower it either. This is a common finding I’ve observed across many FVS runs. This is when looking at the different variables in FVS output matters. Mean annual increment is a volume-based measure which relies on merchantable portions of the tree, and most of the small-diameter trees will barely make it into the merchantable category at 50 years. If you looked at a metric like carbon stock change across all tree sizes, you would likely notice an increase in the annual change rates when looking at all trees.
The NATURAL keyword is flexible. There are several other parameters you could add to the NATURAL keyword and its sister, the PLANT keyword. In other words, there are more inputs that just species and how many seedlings. This includes the percent survival, average age, and average height. For example, you could add different survival percentages to species commonly browsed by white-tailed deer. Although, one should consider whether adding species which are browsed when they’re less than a foot tall really matters in a long-term growth simulation. This is where you might consider a dynamic regeneration approach.
Add regeneration after adjusting mortality. This is a matter of preference, but one that I’ve found works well for many of the eastern FVS variants. My overall philosophy to calibrating FVS involves three steps: mortality (to tame the overestimates of volume and growth), regeneration (to include species that will form the future forest), and growth (to dial in the expected growth rates for a forest type). Order matters here, but it’s an approach that has some flexibility.
In summary, we still have some work ahead of us to align our FVS growth projections to our benchmark growth rate of 0.48 cords/ac/yr. Adding regeneration is an investment into the future forest, making sure that is has the diversity and number of seedlings that we expect. Our job is not finished in calibrating these 300+ plots in FVS, but we’re on the right track.
–
By Matt Russell. Subscribe to our monthly email newsletter for data and analytics trends in the forest products industry. We send one email on the last Thursday of every month.